canvas绘制饼状图
2018-09-10 19:45
113 查看
canvas绘制饼状图
<!DOCTYPE html>
<html lang="en">
<head>
<meta charset="UTF-8">
<title>绘制饼状图</title>
<style>
canvas {
border: 1px solid #ccc;
display: block;
margin: 100px auto;
}
</style>
</head>
<body>
<canvas width="600" height="400"></canvas>
<script>
//1、绘制饼状图
//2、绘制饼状图标题
//3、绘制说明
//创建构造函数
let PieChart = function () {
this.ctx = document.querySelector("canvas").getContext("2d");
//获取画布的宽高
this.canvasW = this.ctx.canvas.width;
this.canvasH = this.ctx.canvas.height;
//获取圆心
this.x0 = this.canvasW / 2 + 60;
this.y0 = this.canvasH / 2;
this.radius = 150;
//设置伸出的线
this.outLine = 20;
//设置矩形的宽高
this.rectW = 30;
this.rectH = 15;
//设置离画布的间距
this.space = 20;
};
PieChart.prototype = {
//初始化饼状图
init: function (data) {
this.drawPie(data);
},
//绘制饼图
drawPie: function (data) {
//1、准备数据
let angleList = this.drawAngle(data);
let that = this;
//声明一个起始弧度
let startAngle = 0;
angleList.forEach(function (item, index) {
//结束弧度
let endAngle = item.angle + startAngle;
that.ctx.beginPath();
that.ctx.moveTo(that.x0, that.y0);
that.ctx.arc(that.x0, that.y0, that.radius, startAngle, endAngle);
that.ctx.closePath();
//设置随机颜色
let color = that.getColor();
that.ctx.fillStyle = color;
that.ctx.fill();
that.drawTitle(startAngle, endAngle, color, item.title);
that.drawDesc(index, item.title, color);
startAngle = endAngle;
})
},
//绘制标题
drawTitle: function (startAngle, endAngle, color, title) {
//确定从圆心到外面这条线的长度 r + 20
//计算伸出去点的坐标
//正弦边 = 斜边 * sin(角度)
//余弦边 = 斜边 * cos(角度)
//确定弧度 = (扇形的起始弧度 + 对应弧度)/ 2
//伸出去的点的坐标 x = x0 + 余弦边 y = y0 + 正弦边
//斜边的长度
let edge = this.radius + this.outLine;
//X轴方向
let edgeX = edge * Math.cos((startAngle + endAngle) / 2);
//Y轴方向
let edgeY = edge * Math.sin((startAngle + endAngle) / 2);
//伸出去的坐标
let outX = this.x0 + edgeX;
let outY = this.y0 + edgeY;
this.ctx.beginPath();
this.ctx.moveTo(this.x0, this.y0);
this.ctx.lineTo(outX, outY);
this.ctx.strokeStyle = color;
this.ctx.stroke();
//画文字和下划线
//1、判断线的方向
//设置文字字体
this.ctx.font = '14px serif';
let textW = this.ctx.measureText(title).width;
this.ctx.textBaseline = "bottom";
//判断
if (outX > this.x0) {
this.ctx.lineTo(outX + textW, outY);
this.ctx.textAlign = 'left';
} else {
this.ctx.lineTo(outX - textW, outY);
this.ctx.textAlign = 'right';
}
this.ctx.fillText(title, outX, outY);
this.ctx.stroke();
},
//绘制说明
drawDesc: function (index, title, color) {
// this.ctx.fillStyle = color;
this.ctx.fillRect(this.space, this.space * (index+1), this.rectW, this.rectH);
this.ctx.textAlign = "left";
this.ctx.textBaseline = "top";
this.ctx.fillText(title, this.space + this.rectW + 10 , this.space * (index+1));
},
drawAngle: function (data) {
let total = 0;
data.forEach(function (item, index) {
total += item.num;
});
data.forEach(function (item, index) {
let angle = item.num / total * 2 * Math.PI;
item.angle = angle;
});
return data;
},
getColor: function () {
let r = Math.random() * 256;
let g = Math.random() * 256;
let b = Math.random() * 256;
return "rgb(" + r + "," + g + "," + b + ")";
}
};
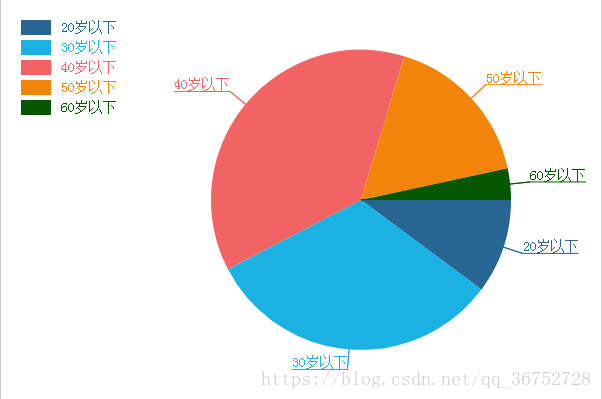
let data = [
{title: "20岁以下", num: 6},
{title: "30岁以下", num: 19},
{title: "40岁以下", num: 22},
{title: "50岁以下", num: 10},
{title: "60岁以下", num: 2},
];
let pieChart = new PieChart();
pieChart.init(data);
</script>
</body>
</html>
效果如图:

相关文章推荐
- 用canvas 绘制的饼状统计图、柱状统计图、折线统计图
- Android编程实现canvas绘制饼状统计图功能示例【自动适应条目数量与大小】
- canvas+js绘制饼状统计图
- Android:使用canvas绘制饼状统计图(自动适应条目数量/大小)
- javascript+HTML5 Canvas绘制转盘抽奖
- JavaScript+html5 canvas绘制的圆弧荡秋千效果完整实例
- js+canvas简单绘制圆圈的方法
- canvas绘制正文形并填充-2
- canvas绘制星空
- 使用CANVAS绘制LED点阵时钟
- js HTML5 Canvas绘制转盘抽奖
- Canvas-drawImage 绘制图片模糊问题
- android Canvas 向左上、右上、左下 方向绘制矩形不能跟随手指移动问题
- canvas 绘制图形2
- Canvas 绘制粒子动画背景
- HTML5 canvas绘制雪花飘落动画(需求分析、知识点、程序编写分布详解)
- Android Canvas绘制丘比特之箭
- 【HTML】Canvas(2)-绘制文本
- canvas绘制圆环进度条
- canvas绘制环形进度条