JFreeChart动态画折线图的方法
2018-06-19 11:19
681 查看
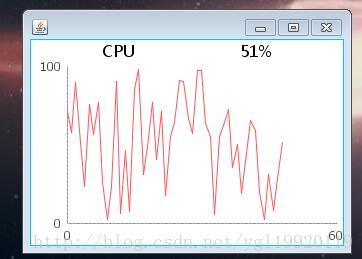
每隔一秒画一次,一分钟后重新画
需要的jar包是:gnujaxp.jar,jcommon-1.0.16.jar,jfreechart-1.0.13.jar
public class JFreeZheXianTest{
public static XYSeries xyCPUseries = new XYSeries("CPU");
public static int hundroud = 0;
public static JFreeChart jfreechart = null;
public JPanel getCPUJFreeChart(){
jfreechart = ChartFactory.createXYLineChart(
null, null, null, createDataset1(),
PlotOrientation.VERTICAL, false, true, false);
StandardChartTheme mChartTheme = new StandardChartTheme("CN");
mChartTheme.setLargeFont(new Font("黑体", Font.BOLD, 20));
mChartTheme.setExtraLargeFont(new Font("宋体", Font.PLAIN, 15));
mChartTheme.setRegularFont(new Font("宋体", Font.PLAIN, 15));
ChartFactory.setChartTheme(mChartTheme);
jfreechart.setBorderPaint(new Color(0,204,205));
jfreechart.setBorderVisible(true);
XYPlot xyplot = (XYPlot) jfreechart.getPlot();
// Y轴
NumberAxis numberaxis = (NumberAxis) xyplot.getRangeAxis();
numberaxis.setLowerBound(0);
numberaxis.setUpperBound(100);
numberaxis.setTickUnit(new NumberTickUnit(100d));
// 只显示整数值
numberaxis.setStandardTickUnits(NumberAxis.createIntegerTickUnits());
// numberaxis.setAutoRangeIncludesZero(true);
numberaxis.setLowerMargin(0); // 数据轴下(左)边距
numberaxis.setMinorTickMarksVisible(false);// 标记线是否显示
numberaxis.setTickMarkInsideLength(0);// 外刻度线向内长度
numberaxis.setTickMarkOutsideLength(0);
// X轴的设计
NumberAxis x = (NumberAxis) xyplot.getDomainAxis();
x.setAutoRange(true);// 自动设置数据轴数据范围
// 自己设置横坐标的值
x.setAutoTickUnitSelection(false);
x.setTickUnit(new NumberTickUnit(60d));
// 设置最大的显示值和最小的显示值
x.setLowerBound(0);
x.setUpperBound(60);
// 数据轴的数据标签:只显示整数标签
x.setStandardTickUnits(NumberAxis.createIntegerTickUnits());
x.setAxisLineVisible(true);// X轴竖线是否显示
x.setTickMarksVisible(false);// 标记线是否显示
RectangleInsets offset = new RectangleInsets(0, 0, 0, 0);
xyplot.setAxisOffset(offset);// 坐标轴到数据区的间距
xyplot.setBackgroundAlpha(0.0f);// 去掉柱状图的背景色
xyplot.setOutlinePaint(null);// 去掉边框
// ChartPanel chartPanel = new ChartPanel(jfreechart);
// chartPanel.restoreAutoDomainBounds();//重置X轴
ChartPanel chartPanel = new ChartPanel(jfreechart, true);
return chartPanel;
}
/**
* 该方法是数据的设计
*
* @return
*/
public static XYDataset createDataset1() {
XYSeriesCollection xyseriescollection = new XYSeriesCollection();
xyseriescollection.addSeries(xyCPUseries);
return xyseriescollection;
}
/**
* 随机生成的数据
*/
public static void dynamicRun() {
int i = 0;
while (true) {
double factor = Math.random()*100;
hundroud = (int)factor;
jfreechart.setTitle("CPU的大小是: "+hundroud+"%");
jfreechart.getTitle().setFont(new Font("微软雅黑", 0, 16));//设置标题字体
xyCPUseries.add(i, factor);
try {
Thread.currentThread();
Thread.sleep(1000);
} catch (InterruptedException e) {
e.printStackTrace();
}
i++;
if (i == 60){
i=0;
xyCPUseries.delete(0, 59);
continue;
}
}
}
public static void main(String[] args) {
JFreeZheXianTest jz = new JFreeZheXianTest();
JFrame frame = new JFrame();
frame.setSize(700, 500);
frame.getContentPane().add(jz.getCPUJFreeChart(), BorderLayout.CENTER);
frame.setVisible(true);
frame.setLocationRelativeTo(null); // 窗口居于屏幕正中央
frame.setDefaultCloseOperation(WindowConstants.EXIT_ON_CLOSE);
dynamicRun();
}
}
以上就是本文的全部内容,希望对大家的学习有所帮助,也希望大家多多支持脚本之家。
您可能感兴趣的文章:

相关文章推荐
- JFreeChart动态画折线图
- Echarts教程之通过Ajax实现动态加载折线图的方法
- Echarts 饼图,折线图,柱状图,条形图ajax动态渲染数据方法汇总
- JFreeChart生成折线图(生成图片本地保存,有解决中文乱码的通用方法)
- JFreechart 制作柱状图、饼图、折线图、仪表图等统计图的使用方法
- jfreechart画折线图的方法
- JFreeChart生成动态折线图
- jqplot通过ajax动态画折线图的方法及思路
- jfreechart生成折线图 | 饼图 | 柱状图 | 堆栈柱状图 及常见乱码处理方法
- jqplot通过ajax动态画折线图的方法及思路
- Android设计模式之动态代理,实现方法拦截功能
- JavaScript动态加载CSS的三种方法
- DLL的动态加载方法
- 动态调用动态库方法 | from web
- OC中动态创建可变数组的问题.有一个数组,数组中有13个元素,先将该数组进行分组,每3个元素为一组,分为若干组,最后用一个数组统一管理这些分组.(要动态创建数组).两种方法
- vue-router2.0 组件之间传参及获取动态参数的方法
- jquery的load方法为元素动态加载内容
- 通过java反射机制动态调用某方法的总结
- ios runtime 动态向类添加方法
- jQuery on()方法给动态生成的元素绑定事件----实战分析