STM32--KEIL的printf打印-ITM机制
2018-03-16 11:38
627 查看
http://www.keil.com/support/man/docs/ulink2/ulink2_trace_itm_viewer.htm
http://www.keil.com/support/man/docs/jlink/jlink_trace_itm_viewer.htmDebug (printf) Viewer
Home » µVision Windows » Debug (printf) ViewerThe Debug (printf) Viewer window displays data streams that are transmitted sequentially through the ITM Stimulus Port0. Enable ITM Stimulus Port 0.
To use the viewer for trace output:Add ITM Stimulus Port register definitions to the source code.
#define ITM_Port8(n)    (*((volatile unsigned char *)(0xE0000000+4*n)))
#define ITM_Port16(n)   (*((volatile unsigned short*)(0xE0000000+4*n)))
#define ITM_Port32(n)   (*((volatile unsigned long *)(0xE0000000+4*n)))

#define DEMCR           (*((volatile unsigned long *)(0xE000EDFC)))
#define TRCENA          0x01000000
Add a fputc function which writes to the ITM Stimulus Port 0 register to the source code, which allows using printf for debug output.
struct __FILE { int handle; /* Add whatever needed */ };
FILE __stdout;
FILE __stdin;

int fputc(int ch, FILE *f) {
if (DEMCR & TRCENA) {
while (ITM_Port32(0) == 0);
ITM_Port8(0) = ch;
}
return(ch);
}
Add the debug trace messages.
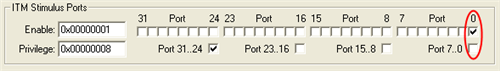
printf("AD value = 0x%04X\r\n", AD_value);Set ITM Stimulus Port Port 0 bit to allow Trace to capture the ITM Port 0 information. Clear the Port 7..0 privilege bit to allow access to the Port 0 bit from User mode.
Select View - Serial Windows - Debug (printf) Viewer to launch the window.


NoteOnly data transmitted over ITM Stimulus port 0 is displayed in the Debug (printf) Viewer window. Other ITM Ports can be monitored with the Trace Records Window.

相关文章推荐
- STM32--KEILprintf打印--SEMIHOST机制
- STM--KEIL printf打印--ITM机制(亲测成功)
- 运用keil的ULINK2下的ITM机制打印调试信息
- STM32高级开发(12)-在GCC中使用printf打印串口数据
- 使用printf函数实现串口信息打印——设置IAR和Keil的Options
- STM32 keil printf的使用
- keil 中调用printf 的使用 在软件调试下 serial windows 下显示答打印信息
- STM32下Keil IDE中Printf函数的使用
- STM32串口通信中使用printf发送数据配置方法 开发环境 Keil
- STM32 printf函数打印到串口(刘凯)
- MDK硬件调试_在Debug printf Viewer窗口显示打印信息_ITM
- stm32 keil实现串口printf输出中文字符
- 关于stm32用J-link,ITM机制下动态调试
- STM32中使用printf打印串口数据
- 009:semihost/ITM机制浅析以及使用JLINK通过ITM调试stm32单片机(转)
- keil环境下stm32 对printf映射
- STM32 keil printf的使用
- STM32串口打印printf
- STM32多串口共用printf打印串口数据
- STM32在IAR和MDK中使用printf进行串口打印的实现方法