Django学习之路
2018-02-27 23:28
459 查看
1.def __str__(self):
return self.namefanh返回添加的字段名称

2.
editable 属性可以让类选择是否显示在后台上。
3.python.manage.py shell 进入shell操作数据库,
from your.models import yourclass
from django.utils import timezone
yourclass.objects.all() 查看所有对象
yourclass.objects.all()[0].timename 查看时间
4.使用django的date 过滤器分割年月日。
使用Form表单上传文件并展示。
于2018\3\19增加
5.Django+Pyecharts制作3D图
创建一个django项目
编写视图
return self.namefanh返回添加的字段名称
2.
editable 属性可以让类选择是否显示在后台上。
3.python.manage.py shell 进入shell操作数据库,
from your.models import yourclass
from django.utils import timezone
yourclass.objects.all() 查看所有对象
yourclass.objects.all()[0].timename 查看时间
4.使用django的date 过滤器分割年月日。
使用Form表单上传文件并展示。
于2018\3\19增加
5.Django+Pyecharts制作3D图
创建一个django项目
django-admin startproject djecharts添加app应用
python manage.py startapp myechart在 djecharts/settings.py 中注册应用程序
INSTALLED_APPS = [
'django.contrib.admin',
'django.contrib.auth',
'django.contrib.contenttypes',
'django.contrib.sessions',
'django.contrib.messages',
'django.contrib.staticfiles',
'myechart'
]
编写视图
from django.shortcuts import render
from pyecharts import Line3D
import math
# Create your views here.
def index(request):
context = {
"myechart": line3d()
}
return render(request, 'pyecharts.html', context)
def line3d():
_data = []
for t in range(0, 25000):
_t = t / 1000
x = (1 + 0.25 * math.cos(75 * _t)) * math.cos(_t)
y = (1 + 0.25 * math.cos(75 * _t)) * math.sin(_t)
z = _t + 2.0 * math.sin(75 * _t)
_data.append([x, y, z])
range_color = ['#313695', '#4575b4', '#74add1', '#abd9e9', '#e0f3f8', '#ffffbf',
'#fee090', '#fdae61', '#f46d43', '#d73027', '#a50026']
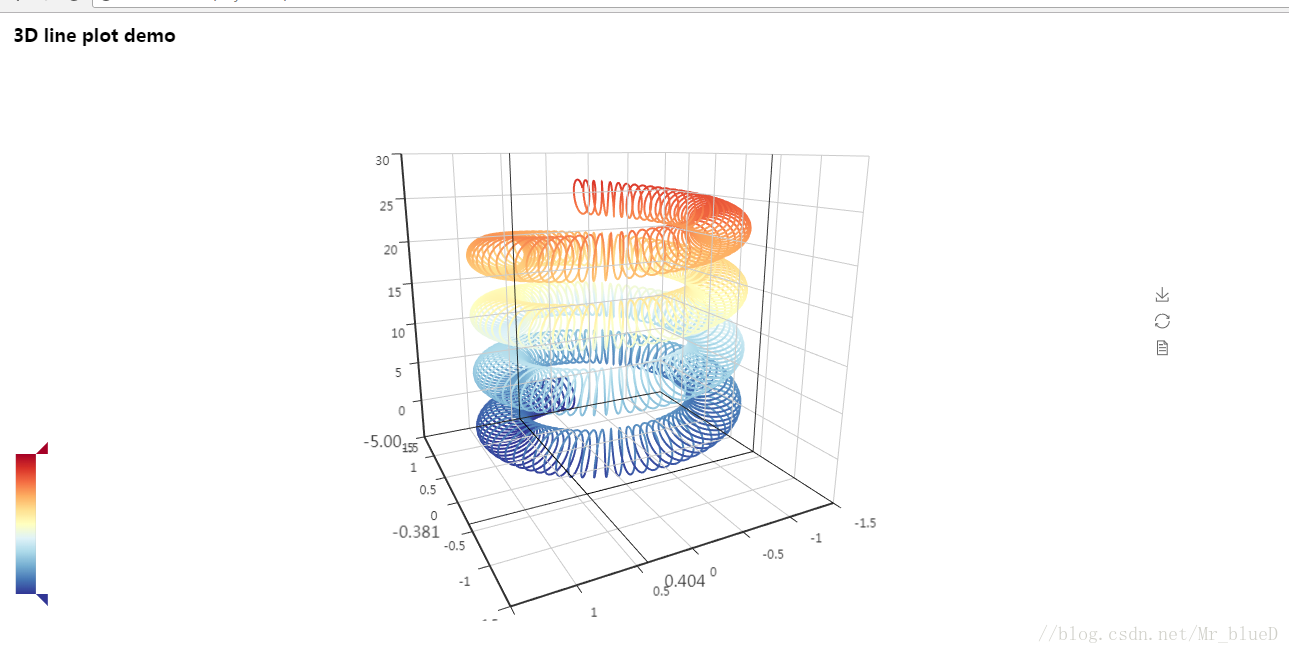
line3d = Line3D("3D line plot demo", width=1200, height=600)
line3d.add("", _data, is_visualmap=True, visual_range_color=range_color, visual_range=[0, 30],
is_grid3D_rotate=True, grid3D_rotate_speed=180)
return line3d.render_embed()设置模板,在myechart下创建文件夹templates,在myechart/templates下添加html模板pyeachrts.html,,将下面的内容复制进去保存即可。<!DOCTYPE html>
<html>
<head>
<meta charset="utf-8">
<title>ECharts</title>
<script src="http://oog4yfyu0.bkt.clouddn.com/echarts.min.js"></script>
<script src="http://oog4yfyu0.bkt.clouddn.com/echarts-gl.js"></script>
<script type="text/javascript " src="http://echarts.baidu.com/gallery/vendors/echarts/map/js/china.js"></script>
<script type="text/javascript " src="http://echarts.baidu.com/gallery/vendors/echarts/map/js/world.js"></script>
<script type="text/javascript " src="http://oog4yfyu0.bkt.clouddn.com/wordcloud.js"></script>
</head>
<body>
{{myechart|safe}}
</body>
</html>绑定url,在myechart/urls.py下添加from django.conf.urls import url from django.contrib import admin from myechart import views urlpatterns = [ url(r'^admin/', admin.site.urls), url(r'^myfirstvis/$', views.index, name='index'), ]从命令行进入项目文件下,执行djang项目
python manage.py runserver打开网址就可以看到3D图了。

相关文章推荐
- Django学习之路(五)template的学习
- django学习之路(二)
- Python学习之路——django(一)
- Django学习之路
- django学习之路(三)
- Django学习之路
- django学习之路(一)
- Django学习之路4-Models
- django学习之路
- Django学习之路3-项目与应用
- Django学习之路2-环境的搭建(virtualenv)
- django学习之路
- Django学习之路1-Django简介
- Django学习之路(八)Admin的学习
- python3 + Django 学习之路(一)
- Python学习之路【第二篇】-pyc简介、Python常用的数据类型及其用法和常用运算符
- 大数据学习之路
- (转)Bootstrap 之 Metronic 模板的学习之路 - (5)主题&布局配置
- Android开发学习之路--UI之基本布局
- cocos2dx学习之路----第十二篇(关于Node节点的自我更新函数Update探讨及定时器的使用)