基于用户和商品画像的商品推荐
2018-02-08 11:31
253 查看
1. 用户画像以及商品属性画像特征提取
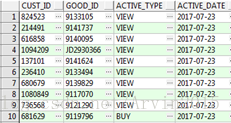
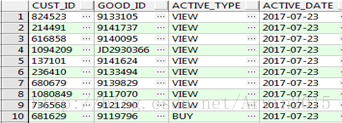
初始数据源包括四个字段 客户Id、商品Id、active_type表示用户行为:VIEW 浏览,BUY 购买,CART 购物车。
用户维度特征
·总的购买量:用户的购物热情
·总的点击量:表示用的活跃度
·总购买/总点击:表示用户购物的果断程度
商品维度特征
·总的被购买量:商品的热情度
·总的被点击量:产品是否吸引人
·总的被购买/总的被点击:产品的质量
2. 步骤:
①数据准备:
②统计商品总的被点击和购买量
select t.good_id, count(*) asitem_total_count
from DS_CUST_GOOD_RECOMMEND t
where t.active_type in ('VIEW','BUY')
group by t.good_id
③统计每个商品总的被购买量
select t.good_id, count(*) asitem_total_buy
from DS_CUST_GOOD_RECOMMEND t
where t.active_type = 'BUY'
group by t.good_id
④每个商品的点击购买率
create table DS_GOOD_RATE AS
select t3.*,
t4.item_total_count,
t3.item_total_buy / t4.item_total_countas item_buy_rate
from (select t2.*, t1.item_total_buy
from (select t.good_id, count(*) asitem_total_buy
from DS_CUST_GOOD_RECOMMEND t
where t.active_type = 'BUY'
group by t.good_id) t1,
DS_CUST_GOOD_RECOMMEND t2
where t1.good_id = t2.good_id) t3,
(select t.good_id, count(*) asitem_total_count
from DS_CUST_GOOD_RECOMMEND t
where t.active_type in ('VIEW', 'BUY')
group by t.good_id) t4
where t3.good_id = t4.good_id
⑤每个用户总的购买点击量
select t.cust_id, count(*) asuser_total_count
from DS_CUST_GOOD_RECOMMEND t
where t.active_type in ('VIEW','BUY')
group by t.cust_id
⑥每个用户总的购买量
select t.cust_id, count(*) asuser_total_buy_count
from DS_CUST_GOOD_RECOMMEND t
where t.active_type = 'BUY'
group by t.cust_id
⑦每个用户的点击购买率
selectt3.*,t4.user_total_count,t3.user_total_buy_count/user_total_count asuser_buy_rate from(
select t2.*,t1.user_total_buy_countfrom (
select t.cust_id, count(*) asuser_total_buy_count
from DS_CUST_GOOD_RECOMMEND t
where t.active_type = 'BUY'
group by t.cust_id
) t1,DS_CUST_GOOD_RECOMMEND t2
where t1.cust_id = t2.cust_id
) t3,(select t.cust_id, count(*)as user_total_count
from DS_CUST_GOOD_RECOMMEND t
where t.active_type in ('VIEW','BUY')
group by t.cust_id
) t4
where t3.cust_id=t4.cust_id
⑧加入目标列
create table ds_cust_good_mblabelas
select d1.cust_id,
d1.good_id,
case d1.active_type
when 'VIEW' then '0'
when 'BUY' then '1'
when 'CART' then '2'
end as active_type,
substr(d1.active_date, 6, 2) asactive_date,
d1.user_total_buy_count,
d1.user_total_count,
d1.user_buy_rate,
d2.item_total_buy,
d2.item_total_count,
d2.item_buy_rate,
case d1.active_type
when 'BUY' then '1'
else '0'
end as mblabel
from ds_cust_rate d1, ds_good_rate d2
where d1.cust_id = d2.cust_id
and d1.good_id = d2.good_id
and d1.active_type = d2.active_type
⑨去重
create tableds_cust_good_mblabel2 as
select * from (
select distinct t.cust_id,
t.good_id,
t.active_type,
t.active_date,
t.user_total_buy_count,
t.user_total_count,
t.user_buy_rate,
t.item_total_buy,
t.item_total_count,
t.item_buy_rate,
t.mblabel
from ds_cust_good_mblabel t
)
drop table ds_cust_good_mblabel
把表ds_cust_good_mblabel2 重新命名为 ds_cust_good_mblabel
3、用R语言进行建模、分析,与数据库进行连接
①与数据库进行连接
library(RJDBC)
drv=JDBC("oracle.jdbc.OracleDriver","C:\\ProgramFiles\\R\\ojdbc6.jar",identifier.quote="\"")
conn=dbConnect(drv,"jdbc:oracle:thin:@//ip地址/数据库","用户名","密码")
②提取数据
tt=dbGetQuery(conn,"selectt.user_total_buy_count as x1,t.user_total_count as x2,t.user_buy_rate as x3,t.item_total_buy as x4,t.item_total_count asx5,t.item_buy_rate as x6,t.mblabel as y from DS_CUST_GOOD_MBLABEL t wheret.active_date not in ('08', '09') order byt.cust_id,t.good_id,t.active_type")
③数据归一化(最大、最小规范化)
x1<-(tt[,1]-min(tt[,1]))/(max(tt[,1])-min(tt[,1]))
x2<-(tt[,2]-min(tt[,2]))/(max(tt[,2])-min(tt[,2]))
x3<-(tt[,3]-min(tt[,3]))/(max(tt[,3])-min(tt[,3]))
x4<-(tt[,4]-min(tt[,4]))/(max(tt[,4])-min(tt[,4]))
x5<-(tt[,5]-min(tt[,5]))/(max(tt[,5])-min(tt[,5]))
x6<-(tt[,6]-min(tt[,6]))/(max(tt[,6])-min(tt[,6]))
y<-tt$Y
④数据合成数据框
data1<-data.frame(x1,x2,x3,x4,x5,x6,y)
⑤建立逻辑回归模型
fit<- glm(y ~x1+x2+x3+x4+x5+x6,family=binomial(link='logit'),data=data1)
⑥查看模型
summary(fit)
⑦提取预测数据:步骤②-步骤④(去除y)
data2<-data.frame(x1,x2,x3,x4,x5,x6)
⑧预测
predict<- predict(fit,type='response',newdata=data2)
⑨与实际对比
real<- tt$Y
res<- data.frame(real,predict =ifelse(predict>0.5,'1','0'))
res
⑩导出结果集
write.table(res,”d:\\ds_recommed_result.txt”,row.names=FALSE,col.names=FALSE)

相关文章推荐
- 课程四:个性化推荐-基于用户画像的物品推荐 22分钟
- 如何实现基于内容和用户画像的个性化推荐
- 如何实现基于内容和用户画像的个性化推荐
- 如何实现基于内容和用户画像的个性化推荐
- Mahout系列之推荐算法-基于用户协同过滤
- 【知识图谱】复旦大学:基于知识图谱的用户画像技术研究
- 实战智能推荐系统(7)-- 基于用户的协同过滤算法
- mahout基于用户推荐的简单例子(2)
- FTP基于PAM和MySQL/MariaDB实现虚拟用户访问控制 推荐
- 基于用户的最近邻推荐
- 基于MaxCompute构建企业用户画像(用户标签的制作)
- 基于用户的推荐算法
- 信息构建——personas分析(基于落网的用户画像分析)
- <<推荐系统实战>>笔记1,基于用户的协同过滤算法
- 实战智能推荐系统(7)-- 基于用户的协同过滤算法
- 分享我在2014架构师大会演讲材料<<基于用户画像的大数据挖掘实践>>
- 如何基于Spark进行用户画像
- 基于rsync和inotify实现web网站文件的同步,并基于IPTABLES做用户限制 推荐
- 基于MaxCompute构建企业用户画像(用户标签的制作)
- 基于用户的推荐算法