聚类 python中k-means几种初始化质心的方式
2018-01-10 14:34
197 查看
def k_means(X, n_clusters, init='k-means++', precompute_distances='auto',
n_init=10, max_iter=300, verbose=False,
tol=1e-4, random_state=None, copy_x=True, n_jobs=1,
algorithm="auto", return_n_iter=False):
init : {'k-means++', 'random', or ndarray, or a callable}, optional
        Method for initialization, default to 'k-means++':
        'k-means++' : selects initial cluster centers for k-mean
        clustering in a smart way to speed up convergence. See section
        Notes in k_init for more details.

        'random': generate k centroids from a Gaussian with mean and
        variance estimated from the data.

        If an ndarray is passed, it should be of shape (n_clusters, n_features)
        and gives the initial centers.

        If a callable is passed, it should take arguments X, k and
        and a random state and return an initialization.
if n_clusters == 1:
# elkan doesn't make sense for a single cluster, full will produce
# the right result.
algorithm = "full"
if algorithm == "auto":
algorithm = "full" if sp.issparse(X) else 'elkan'
if algorithm == "full":
kmeans_single = _kmeans_single_lloyd
elif algorithm == "elkan":
kmeans_single = _kmeans_single_elkan
else:
raise ValueError("Algorithm must be 'auto', 'full' or 'elkan', got"
" %s" % str(algorithm))def _kmeans_single_elkan(X, n_clusters, max_iter=300, init='k-means++', verbose=False, x_squared_norms=None, random_state=None, tol=1e-4, precompute_distances=True):
    centers = _init_centroids(X, n_clusters, init, random_state=random_state,
                              x_squared_norms=x_squared_norms)
    centers = np.ascontiguousarray(centers)
def _init_centroids(X, k, init, random_state=None, x_squared_norms=None,
                    init_size=None):
    """Compute the initial centroids
init : {'k-means++', 'random' or ndarray or callable} optional Method for initialization if isinstance(init, string_types) and init == 'k-means++':
centers = _k_init(X, k, random_state=random_state,
x_squared_norms=x_squared_norms)
elif isinstance(init, string_types) and init == 'random':
seeds = random_state.permutation(n_samples)[:k]
centers = X[seeds]
elif hasattr(init, '__array__'): #如果init是数组,则用此数组初始化质心
# ensure that the centers have the same dtype as X
# this is a requirement of fused types of cython
centers = np.array(init, dtype=X.dtype)
elif callable(init): #如果init是可调用的函数,可直接调用该函数去生成初始化质心。
centers = init(X, k, random_state=random_state)
centers = np.asarray(centers, dtype=X.dtype)
else:
raise ValueError("the init parameter for the k-means should "
"be 'k-means++' or 'random' or an ndarray, "
"'%s' (type '%s') was passed." % (init, type(init)))下面的转载自《用Python开始机器学习(10:聚类算法之K均值)》博客的一个例子
1、K均值聚类
K-Means算法思想简单,效果却很好,是最有名的聚类算法。聚类算法的步骤如下:1:初始化K个样本作为初始聚类中心;
2:计算每个样本点到K个中心的距离,选择最近的中心作为其分类,直到所有样本点分类完毕;
3:分别计算K个类中所有样本的质心,作为新的中心点,完成一轮迭代。
通常的迭代结束条件为新的质心与之前的质心偏移值小于一个给定阈值。
下面给一个简单的例子来加深理解。如下图有4个样本点,坐标分别为A(-1,-1),B(1,-1),C(-1,1),D(1,1)。现在要将他们聚成2类,指定A、B作为初始聚类中心(聚类中心A0, B0),指定阈值0.1。K-Means迭代过程如下:
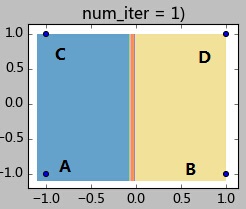
step 1.1:计算各样本距离聚类中心的距离:
样本A:d(A,A0) = 0; d(A,B0) = 2;因此样本A属于A0所在类;
样本B:d(B,A0) = 2; d(B,B0) = 0;因此样本B属于B0所在类;
样本C:d(C,A0) = 2; d(C,B0) = 2.8;;因此样本C属于A0所在类;
样本C:d(D,A0) = 2.8; d(D,B0) = 2;;因此样本C属于B0所在类;
step 1.2:全部样本分类完毕,现在计算A0类(包含样本AC)和B0类(包含样本BD)的新的聚类中心:
A1 = (-1, 0); B1 = (1,0);
step 1.3:计算聚类中心的偏移值是否满足终止条件:
|A1-A0| = |(-1,0)-(-1,-1) | = |(0,1)| = 1 >0.1,因此继续迭代。
此时的状态如下图所示:
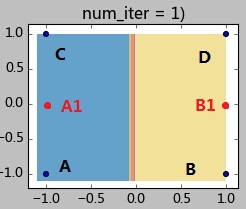
step 2.1:计算各样本距离聚类中心的距离:
样本A:d(A,A1) = 1; d(A,B1) = 2.2;因此样本A属于A1所在类;
样本B:d(B,A1) = 2.2; d(B,B1) = 1;因此样本B属于B1所在类;
样本C:d(C,A1) = 1; d(C,B1) = 2.2;;因此样本C属于A1所在类;
样本D:d(D,A1) = 2.2; d(D,B1) = 1;;因此样本C属于B1所在类;
step 2.2:全部样本分类完毕,现在计算A1类(包含样本AC)和B1类(包含样本BD)的新的聚类中心:
A2 = (-1, 0); B2 = (1,0);
step 2.3:计算聚类中心的偏移值是否满足终止条件:
|A2-A1| = |B2-B1| = 0 <0.1,因此迭代终止。
2、测试数据
下面这个测试数据有点类似SNS中的好友关系,假设是10个来自2个不同的圈子的同学的SNS聊天记录。显然,同一个圈子内的同学会有更密切的关系和互动。数据如下所示,每一行代表一个好友关系。如第一行表示同学0与同学1的亲密程度为9(越高表示联系越密切)。
显然,这个数据中并没有告知我们这10个同学分别属于哪个圈子。因此我们的目标是使用K-Means聚类算法,将他们聚成2类。
[plain] view
plain copy
0 1 9
0 2 5
0 3 6
0 4 3
1 2 8
......
这个例子设计的很简单。我们使用上一篇文章中提到的关系矩阵,将其可视化出来,会看到如下结果:
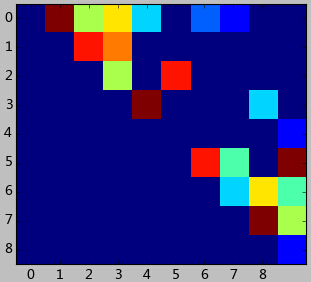
这是个上三角矩阵,因为这个数据中认为好友关系是对称的。上图其实很快能发现,0,1,2,3,4用户紧密联系在一起,而5,6,7,8,9组成了另外一个圈子。
下面我们看看K-Means算法能否找出这个答案。
3、代码与分析
K-Means算法的Python代码如下:[python] view
plain copy
# -*- coding: utf-8 -*-
from matplotlib import pyplot
import scipy as sp
import numpy as np
from sklearn import svm
import matplotlib.pyplot as plt
from sklearn.cluster import KMeans
from scipy import sparse
#数据读入
data = np.loadtxt('2.txt')
x_p = data[:, :2] # 取前2列
y_p = data[:, 2] # 取前2列
x = (sparse.csc_matrix((data[:,2], x_p.T)).astype(float))[:, :].todense()
nUser = x.shape[0]
#可视化矩阵
pyplot.imshow(x, interpolation='nearest')
pyplot.xlabel('用户')
pyplot.ylabel('用户')
pyplot.xticks(range(nUser))
pyplot.yticks(range(nUser))
pyplot.show()
#使用默认的K-Means算法
num_clusters = 2
clf = KMeans(n_clusters=num_clusters, n_init=1, verbose=1)
clf.fit(x)
print(clf.labels_)
#指定用户0与用户5作为初始化聚类中心
init = np.vstack([ x[0], x[5] ])
clf = KMeans(n_clusters=2, init=init)
clf.fit(x)
print(clf.labels_)
输出结果如下:
Initialization complete
Iteration 0, inertia 581.000
Iteration 1, inertia 417.643
Converged at iteration 1
[0 0 1 1 1 1 1 1 1]
[0 0 0 0 1 1 1 1 1]
可以看到,使用默认的K-Means算法将使用随机的初始值,因此每次执行的结果都不一样。
上面的输出中将0,1用户聚类到一起,效果并不理想。然而,如果我们可以确定用户0与用户5是有很大区别的,就可以指定用户0和用户5作为K-Means聚类算法的初始值。可以看到和我们的预期完全一致,这样效果就非常好了。
由于K-Means毕竟是无监督学习,在很多情况下自然无法与有监督学习的算法进行同样标准的比较。但其不需要监督的特性,广泛应用与社交图谱(如本例)、相似性匹配(如搜索相似的新闻、帖子)等引用场景。

相关文章推荐
- python kmeans实战 - 单机一层聚类(小玩具哦),下次再弄个分布式多次聚类
- K-Means聚类的Python实践
- 运行Python程序的几种方式
- Python算法性能提升的几种方式
- python中实现多线程的几种方式
- [Python之道] 几种判断操作系统类型的方式
- Python笔记-几种取整方式
- python之配置日志的几种方式
- Python 输出的几种方式 (print)
- Python模块常用的几种安装方式
- 机器学习算法与Python实践之(五)k均值聚类(k-means)
- Python模块常用的几种安装方式
- selenium java and python获取元素路径的几种方式和实例
- Python3之实现单例模式de几种方式
- python kmeans聚类简单介绍和实现代码
- Python脚本后台运行的几种方式
- Python模块常用的几种安装方式
- 浅谈python和C语言混编的几种方式(推荐)
- Oracle几种清除数据的方式,在平台用别的医院数据库做初始化时有用
- win7下使用python的几种方式