ELK实战之使用filebeat代替logstash收集日志
2018-01-02 13:53
1551 查看
一、Filebeat介绍
Filebeat是轻量级单用途的日志收集工具,用于在没有安装java的服务器上专门收集日志,可以将日志转发到logstash、elasticsearch或redis等场景中进行下一步处理。官方文档:https://www.elastic.co/guide/en/beats/filebeat/6.0/index.html
二、Filebeat安装和配置
1、filebeat安装
#RPM安装
[root@linux-node2 ~]# curl -L -O https://artifacts.elastic.co/downloads/beats/filebeat/filebeat-6.0.1-x86_64.rpm [root@linux-node2 ~]# rpm -vi filebeat-6.0.1-x86_64.rpm

#docker安装
[root@linux-node2 ~]# docker pull docker.elastic.co/beats/filebeat:6.0.1
2、filebeat配置输出到文件测试
[root@linux-node2 ~]# grep -v "#" /etc/filebeat/filebeat.yml |grep -v "^$"
filebeat.prospectors:
- type: log
enabled: true
paths:
- /var/log/*.log
- /var/log/messages      #配置收集的日志路径
exclude_lines: ['^DBG',"^$"]     #排除以DBG开头和空行
document_type: filesystem-log-5612    #设置类型
filebeat.config.modules:
path: ${path.config}/modules.d/*.yml
reload.enabled: false
setup.template.settings:
index.number_of_shards: 3
setup.kibana:
output.file:     #输出到文件
path: "/tmp"
filename: "filebeat.txt"
[root@linux-node2 ~]# systemctl restart filebeat
[root@linux-node2 ~]# echo "666666666666666" >> /var/log/messages
[root@linux-node2 conf.d]# tailf /tmp/filebeat.txt
{"@timestamp":"2018-01-02T03:55:54.680Z","@metadata":{"beat":"filebeat","type":"doc","version":"6.0.1"},"message":"666666666666666","source":"/var/log/messages","offset":3164930,"prospector":{"type":"log"},"beat":{"name":"linux-node2","hostname":"linux-node2","version":"6.0.1"}}
三、配置filebeat输出到redis
[root@linux-node2 ~]# vim /etc/filebeat/filebeat.yml
#修改output
output.redis:
hosts: "192.168.56.12"
db: "2"
port: "6379"
password: "123456"
key: "filesystem-log-5612"
[root@linux-node2 ~]# systemctl restart filebeat
[root@linux-node2 ~]# echo "123456" >> /var/log/messages

#查看redis中是否有数据
[root@linux-node2 ~]# redis-cli -h 192.168.56.12 -a 123456
192.168.56.12:6379> select 2
OK
192.168.56.12:6379[2]> KEYS *
1) "filesystem-log-5612"
192.168.56.12:6379[2]> llen filesystem-log-5612
(integer) 3
192.168.56.12:6379[2]> llen filesystem-log-5612
(integer) 3
192.168.56.12:6379[2]> llen filesystem-log-5612
(integer) 3
192.168.56.12:6379[2]> llen filesystem-log-5612
(integer) 3
192.168.56.12:6379[2]> llen filesystem-log-5612
(integer) 4
四、配置linux-node1节点的logstash取redis中的数据
#配置logstash
[root@linux-node1 conf.d]# vim redis-logstash.conf
input {
redis {
data_type => "list"
host => "192.168.56.12"
db => "2"
port => "6379"
password => "123456"
key => "filesystem-log-5612"
}
}
output {
elasticsearch {
hosts => ["192.168.56.11:9200"]
index => "filesystem-log-5612-%{+YYYY.MM.dd}"
}
}
#检测语法
[root@linux-node1 conf.d]# /usr/share/logstash/bin/logstash -f /etc/logstash/conf.d/redis-logstash.conf -t
OpenJDK 64-Bit Server VM warning: If the number of processors is expected to increase from one, then you should configure the number of parallel GC threads appropriately using -XX:ParallelGCThreads=N
WARNING: Could not find logstash.yml which is typically located in $LS_HOME/config or /etc/logstash. You can specify the path using --path.settings. Continuing using the defaults
Could not find log4j2 configuration at path /usr/share/logstash/config/log4j2.properties. Using default config which logs errors to the console
Configuration OK
#重启logstash
[root@linux-node1 conf.d]# systemctl restart logstash
#写入messages日志
[root@linux-node1 conf.d]# echo "helloworld" >> /var/log/messages
[root@linux-node1 conf.d]# echo "helloworld" >> /var/log/messages
[root@linux-node1 conf.d]# echo "helloworld" >> /var/log/messages
#查看redis数据
[root@linux-node2 ~]# redis-cli -h 192.168.56.12 -a 123456
192.168.56.12:6379> select 2
OK
192.168.56.12:6379[2]> KEYS *
1) "filesystem-log-5612"
192.168.56.12:6379[2]> llen filesystem-log-5612
(integer) 3
192.168.56.12:6379[2]> llen filesystem-log-5612
(integer) 3
192.168.56.12:6379[2]> llen filesystem-log-5612
(integer) 3
192.168.56.12:6379[2]> llen filesystem-log-5612
(integer) 3
192.168.56.12:6379[2]> llen filesystem-log-5612
(integer) 4
192.168.56.12:6379[2]> llen filesystem-log-5612
(integer) 44
192.168.56.12:6379[2]> llen filesystem-log-5612
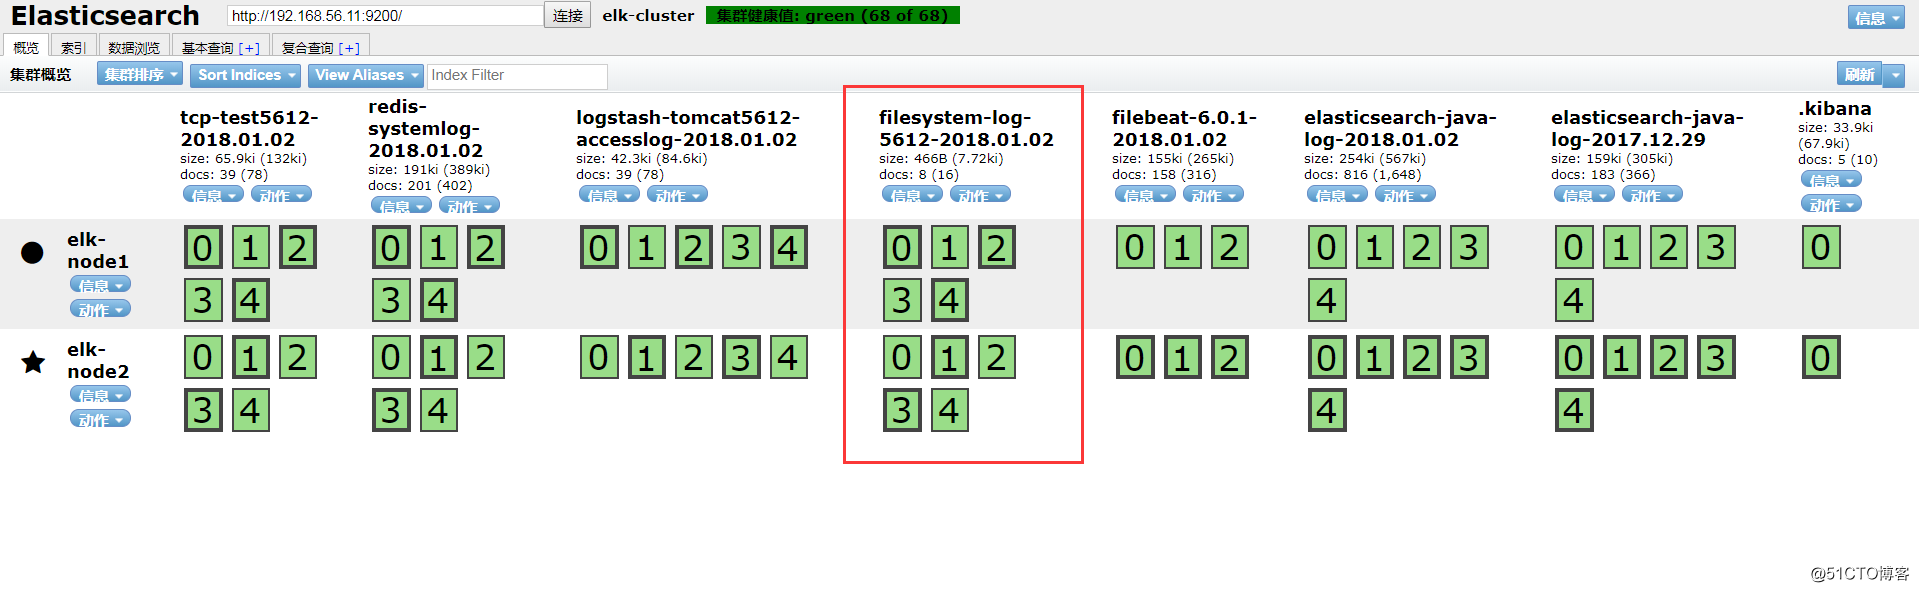
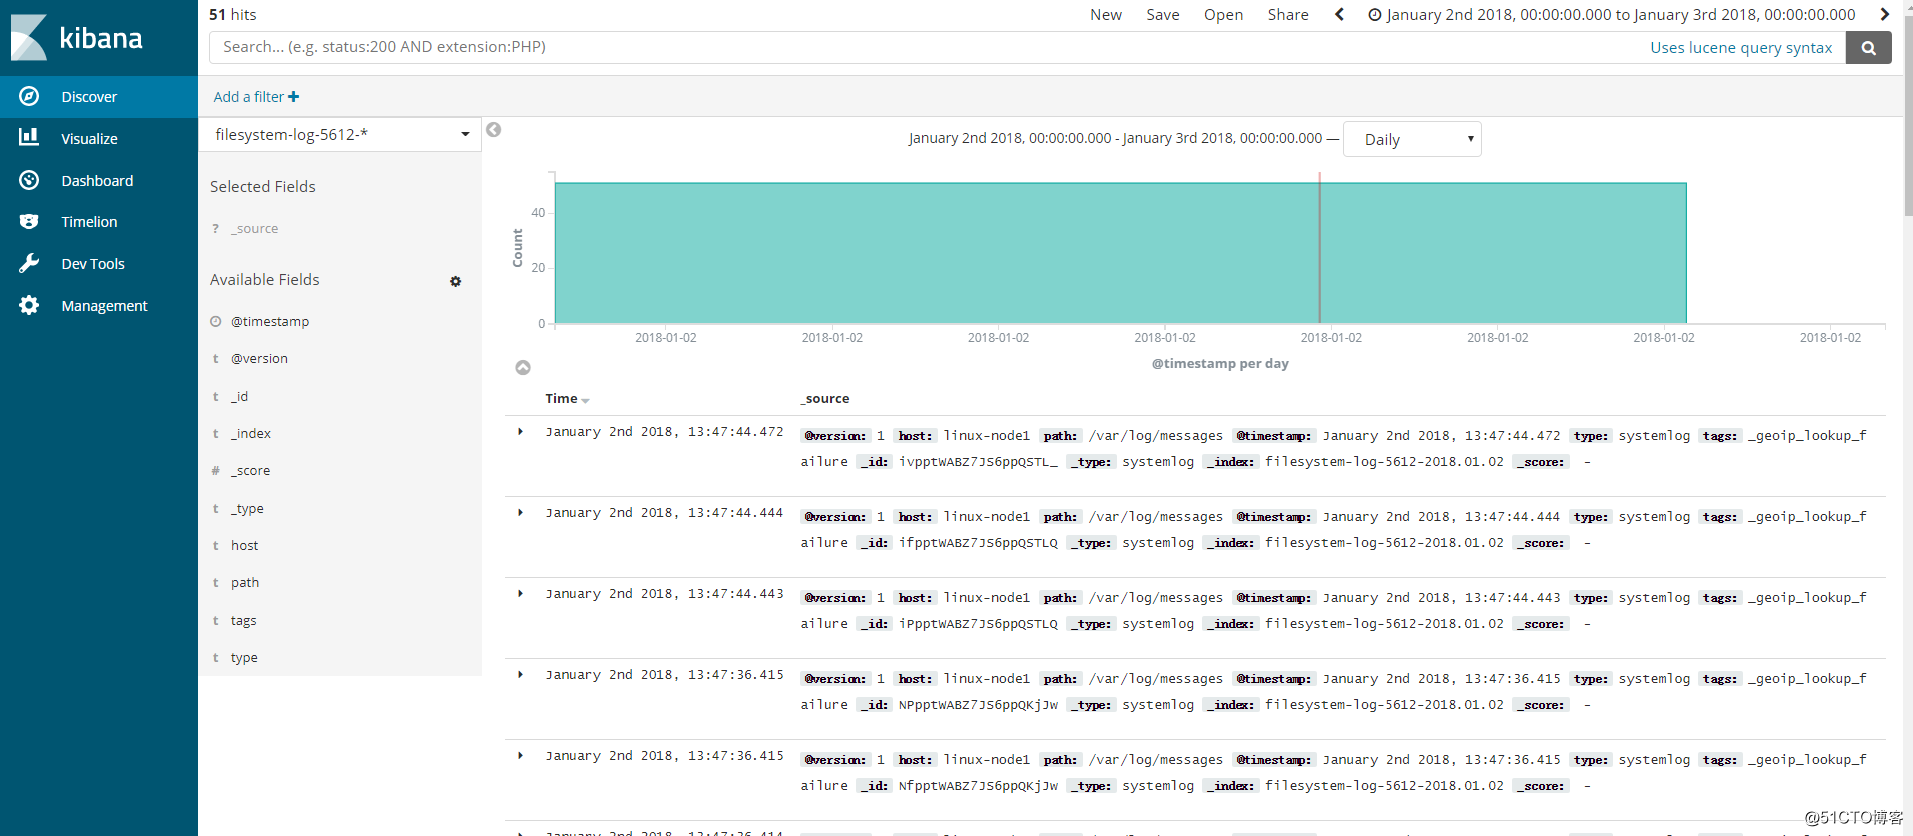
(integer) 0五、head插件查看以及kibana添加索引
六、监控redis长度脚本
为了监控Redis的队列长度,可以写一个监控脚本对redis进行监控,并增加zabbix报警[root@linux-node2 ~]# vim redis-test.py
#!/usr/bin/env python
import redis
def redis_conn():
pool=redis.ConnectionPool(host="192.168.56.12",port=6379,db=2,password=123456)
conn = redis.Redis(connection_pool=pool)
data = conn.llen('filesystem-log-5612')
print(data)
redis_conn()
[root@linux-node2 ~]# python redis-test.py #当前redis队列长度为0
0

相关文章推荐
- elk的安装部署三(kibana的安装及使用filebeat收集日志)
- Linux搭建ELK日志收集系统:FIlebeat+Redis+Logstash+Elasticse
- Kubernetes部署ELK并使用Filebeat收集容器日志
- filebeat -> logstash -> elasticsearch -> kibana ELK 日志收集搭建
- ELK-filebeat收集日志到Kafka,并转存ES
- logstash与filebeat收集日志
- logstash与filebeat收集日志
- ELK日志系统:Filebeat使用及Kibana如何设置登录认证
- ELK实战-Logstash:收集rsyslog日志
- ELK日志处理之使用logstash收集log4J日志
- elk日志分析filebeat配置(filebeat + logstash)
- filebeat+logstash+elasticsearch收集haproxy日志
- logstash与filebeat收集日志
- ELK-filebeat+kafka日志收集
- logstash与filebeat收集日志
- ELK 之Filebeat 结合Logstash 过滤出来你想要的日志
- 使用Filebeat 6 收集多个目录的日志并发送到lostash
- PHP慢日志 ELK+FileBeat收集
- logstash与filebeat收集日志