2、python 科学计算及数据可视化
2017-12-29 17:47
609 查看
NumPy
ndarray, n维度数组对象(矩阵)
* 所有元素必须是相同类型
* ndim属性,维度个数
*shape属性,各维度大校
*dtype属性,数据类型
结果
创建ndarray
运行结果:
矢量化:
矢量运算,相同大小的数组间运算应用在元素上
矢量和标量运算,广播将标量广播到各个元素上
结果
切片
结果:
维度转换:
*转置 transpose
*高维数组转换要制定维度编号(0,1,2...)
维度axis 0,1,2 (列为0 ,1为行,再增加就类推)
运行结果:
常用函数
运行结果
常用函数:
运行结果:
读取文本数据:
运行结果:
matplotlib
运行结果
高斯分布:
结果:
散点图:
柱状图:
矩阵绘图
ndarray, n维度数组对象(矩阵)
* 所有元素必须是相同类型
* ndim属性,维度个数
*shape属性,各维度大校
*dtype属性,数据类型
# -*- coding: utf-8 -*-
import numpy as np

if __name__ == '__main__':
# ndarray  多维数组
rand = np.random.rand(2, 3)
print rand
print type(rand)
print "维度个数", rand.ndim
print "各维度大小",rand.shape
print "数据类型", rand.dtype
结果
C:\Anaconda2\python.exe F:/python01/lect002/lect002_numpy.py
[[ 0.21023712  0.97845314  0.75712835]
[ 0.8307807   0.2628768   0.69734118]]
<type 'numpy.ndarray'>
维度个数 2
各维度大小 (2L, 3L)
数据类型 float64

Process finished with exit code 0
创建ndarray
# -*- coding: utf-8 -*-
import numpy as np

if __name__ == '__main__':
# 创建一维数组
lis = range(10)
print lis
ndarray = np.array(lis)
print ndarray
print ndarray.shape
print ndarray.ndim
print "-------创建二维数组--------------"
lis2 =[range(10),range(10)]
print lis2
array = np.array(lis2)
print array
print array.shape
print "-----创建特殊数组 参数是元组----------"
print np.zeros((3,3))
print np.ones((2,2))
# 随机的数组
print np.empty((4,4))
print np.empty((2,2),int)
print "----创建连续的数组----------------"
arange = np.arange(10)
print arange
print "-------数据类型转换-----------------"
zeros = np.zeros((3, 4), dtype=float)
print zeros
print zeros.dtype
astype = zeros.astype(int)
print astype
print astype.dtype
运行结果:
C:\Anaconda2\python.exe F:/python01/lect002/lect002_numpy02.py
[0, 1, 2, 3, 4, 5, 6, 7, 8, 9]
[0 1 2 3 4 5 6 7 8 9]
(10L,)
1
-------创建二维数组--------------
[[0, 1, 2, 3, 4, 5, 6, 7, 8, 9], [0, 1, 2, 3, 4, 5, 6, 7, 8, 9]]
[[0 1 2 3 4 5 6 7 8 9]
[0 1 2 3 4 5 6 7 8 9]]
(2L, 10L)
-----创建特殊数组 参数是元组----------
[[ 0.  0.  0.]
[ 0.  0.  0.]
[ 0.  0.  0.]]
[[ 1.  1.]
[ 1.  1.]]
[[  1.56067605e-316   1.56231146e-316   1.56229960e-316   1.56231502e-316]
[  1.56231976e-316   1.56231620e-316   1.56231027e-316   1.56230435e-316]
[  1.56231265e-316   1.56221423e-316   1.56229842e-316   1.56223557e-316]
[  1.56221423e-316   1.56231502e-316   1.56221423e-316   1.56239091e-316]]
[[16843009 16843009]
[16843009 16843009]]
----创建连续的数组----------------
[0 1 2 3 4 5 6 7 8 9]
-------数据类型转换-----------------
[[ 0.  0.  0.  0.]
[ 0.  0.  0.  0.]
[ 0.  0.  0.  0.]]
float64
[[0 0 0 0]
[0 0 0 0]
[0 0 0 0]]
int32

Process finished with exit code 0
矢量化:
矢量运算,相同大小的数组间运算应用在元素上
矢量和标量运算,广播将标量广播到各个元素上
# -*- coding: utf-8 -*-
import numpy as np

if __name__ == '__main__':
# ndarray的矢量化
arange = np.arange(3)
np_arange = np.arange(3, 6)
print arange
print np_arange
print arange+np_arange
print 2*arange
结果
C:\Anaconda2\python.exe F:/python01/lect002/lect002_numpy03.py
[0 1 2]
[3 4 5]
[3 5 7]
[0 2 4]
切片
# ndarray的切片
n = np.arange(12)
print n
print n[2:4]
reshape = n.reshape(3, 4)
print reshape
print reshape[1]
print reshape[:2, 2:4]
#条件索引  多个条件使用 &  或者 |
year_array = np.array([[2000, 2001, 2002], [2003, 2004, 2005], [2006, 2007, 2008]])
print year_array
is_year_after_2004 = year_array>2004
print is_year_after_2004
# 最后的数组是一维数组
print year_array[is_year_after_2004]
结果:
[ 0  1  2  3  4  5  6  7  8  9 10 11]
[2 3]
[[ 0  1  2  3]
[ 4  5  6  7]
[ 8  9 10 11]]
[4 5 6 7]
[[2 3]
[6 7]]
[[2000 2001 2002]
[2003 2004 2005]
[2006 2007 2008]]
[[False False False]
[False False  True]
[ True  True  True]]
[2005 2006 2007 2008]
维度转换:
*转置 transpose
*高维数组转换要制定维度编号(0,1,2...)
维度axis 0,1,2 (列为0 ,1为行,再增加就类推)
import numpy as np

if __name__ == '__main__':
rand = np.random.rand(2, 3)
print rand
print rand.transpose()
print rand.transpose(1,0)

random_rand = np.random.rand(2, 3, 4)
print random_rand
print random_rand.transpose(1,0,2)
运行结果:
C:\Anaconda2\python.exe F:/python01/lect002/lect002_transfer.py
[[ 0.55045248  0.67183506  0.68011376]
[ 0.12724309  0.18932144  0.49323607]]
[[ 0.55045248  0.12724309]
[ 0.67183506  0.18932144]
[ 0.68011376  0.49323607]]
[[ 0.55045248  0.12724309]
[ 0.67183506  0.18932144]
[ 0.68011376  0.49323607]]
[[[ 0.10286321  0.33290148  0.69265064  0.14793831]
[ 0.21150213  0.06612363  0.62607419  0.2727764 ]
[ 0.82718353  0.97353082  0.29052988  0.98272131]]

[[ 0.63500486  0.57253861  0.19738308  0.32425578]
[ 0.91304141  0.23796068  0.46761624  0.74755873]
[ 0.95759612  0.61779126  0.64942146  0.66568574]]]
[[[ 0.10286321  0.33290148  0.69265064  0.14793831]
[ 0.63500486  0.57253861  0.19738308  0.32425578]]

[[ 0.21150213  0.06612363  0.62607419  0.2727764 ]
[ 0.91304141  0.23796068  0.46761624  0.74755873]]

[[ 0.82718353  0.97353082  0.29052988  0.98272131]
[ 0.95759612  0.61779126  0.64942146  0.66568574]]]

Process finished with exit code 0
常用函数
# -*- coding: utf-8 -*-
import numpy as np
# 通用函数
if __name__ == '__main__':
rand = np.random.rand(2, 3)
print rand
# 向上取整
print np.ceil(rand)
# 向下取整
print np.floor(rand)
# 四舍五入
print np.rint(rand)
# 判断是否是nan
print np.isnan(rand)
运行结果
C:\Anaconda2\python.exe F:/python01/lect002/lect002_numpy005.py
[[ 0.30769093  0.60175561  0.10805398]
[ 0.45100185  0.2759167   0.08227846]]
[[ 1.  1.  1.]
[ 1.  1.  1.]]
[[ 0.  0.  0.]
[ 0.  0.  0.]]
[[ 0.  1.  0.]
[ 0.  0.  0.]]
[[False False False]
[False False False]]

Process finished with exit code 0
常用函数:
# -*- coding: utf-8 -*-
import numpy as np

if __name__ == '__main__':
rand = np.random.rand(2, 3)
print rand
where = np.where(rand > 0.5, 1, 0)
print where
print "--------------------------------"
reshape = np.random.rand(12).reshape(3, 4)
print reshape
print np.sum(reshape)
# 同一列相加
print np.sum(reshape,axis=0)
# 同一行相加
print np.sum(reshape,axis=1)
print np.any(reshape>0.5)
print np.all(reshape>0.5)
print "======================="
ranage = np.array([1, 2, 3, 4, 2, 3])
print ranage
print np.unique(ranage)
运行结果:
C:\Anaconda2\python.exe F:/python01/lect002/lect002_numpy_where.py
[[ 0.84612841  0.12221903  0.58630742]
[ 0.03635271  0.55302229  0.4427165 ]]
[[1 0 1]
[0 1 0]]
--------------------------------
[[ 0.40210732  0.46221939  0.38169504  0.85805883]
[ 0.55928184  0.5255376   0.07921358  0.69144592]
[ 0.99119277  0.85753681  0.80399766  0.38187579]]
6.99416254185
[ 1.95258192  1.8452938   1.26490628  1.93138054]
[ 2.10408058  1.85547893  3.03460303]
True
False
=======================
[1 2 3 4 2 3]
[1 2 3 4]

Process finished with exit code 0
读取文本数据:
# -*- coding: utf-8 -*-
import numpy as np

if __name__ == '__main__':
file_name ="../presidential_polls.csv"
loadtxt = np.loadtxt(fname=file_name,
delimiter=",",  # 分隔符
dtype=str,  # 数据类型
usecols=(0, 2, 3)  # 指定读取的索引列
)
print loadtxt,loadtxt.shape
print "===================================="
np_loadtxt = np.loadtxt(fname=file_name,
delimiter=",",  # 分隔符
skiprows=1,  # 跳过的行
dtype={"names": ('cycle', 'type', 'matchup'),
"formats": ('i4', 'S15', 'S50')},
usecols=(0, 2, 3)
)
print np_loadtxt, np_loadtxt.shape
运行结果:
C:\Anaconda2\python.exe F:/python01/lect002/lect002_readtxt.py
[['cycle' 'type' 'matchup']
['2016' '"polls-plus"' '"Clinton vs. Trump vs. Johnson"']
['2016' '"polls-plus"' '"Clinton vs. Trump vs. Johnson"']
...,
['2016' '"polls-only"' '"Clinton vs. Trump vs. Johnson"']
['2016' '"polls-only"' '"Clinton vs. Trump vs. Johnson"']
['2016' '"polls-only"' '"Clinton vs. Trump vs. Johnson"']] (10237L, 3L)
====================================
[(2016, '"polls-plus"', '"Clinton vs. Trump vs. Johnson"')
(2016, '"polls-plus"', '"Clinton vs. Trump vs. Johnson"')
(2016, '"polls-plus"', '"Clinton vs. Trump vs. Johnson"') ...,
(2016, '"polls-only"', '"Clinton vs. Trump vs. Johnson"')
(2016, '"polls-only"', '"Clinton vs. Trump vs. Johnson"')
(2016, '"polls-only"', '"Clinton vs. Trump vs. Johnson"')] (10236L,)

Process finished with exit code 0
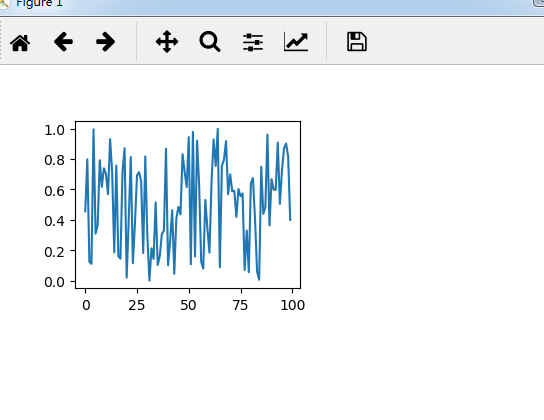
matplotlib
# -*- coding: utf-8 -*-
import numpy as np
import matplotlib.pyplot as plt
if __name__ == '__main__':
fig = plt.figure()
fig.add_subplot(2,2,1)
rand = np.random.rand(100)
plt.plot(rand)
plt.show()
运行结果
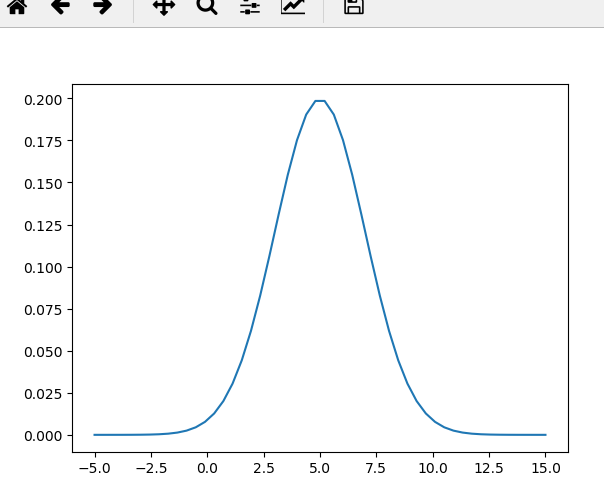
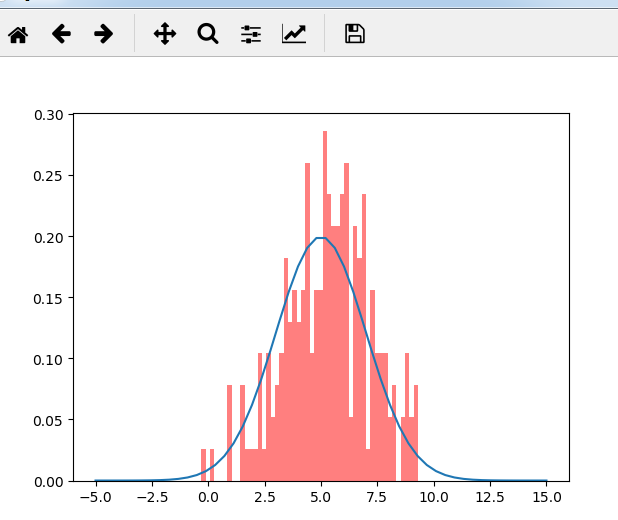
高斯分布:
# -*- coding: utf-8 -*-
import numpy as np
import matplotlib.pyplot as plt
import scipy as sp
from scipy import stats
if __name__ == '__main__':
fig = plt.figure()
fig.add_subplot(2,2,1)
rand = np.random.rand(100)
print rand
plt.plot(rand)
plt.show()
print "----------------------高斯分布"
x = np.linspace(-5, 15, 50)
plt.plot(x, sp.stats.norm.pdf(x=x, loc=5, scale=2))
# 生成直方图
plt.hist(sp.stats.norm.rvs(loc=5, scale=2, size=200), bins=50, normed=True, color='red', alpha=0.5)
plt.show()
结果:
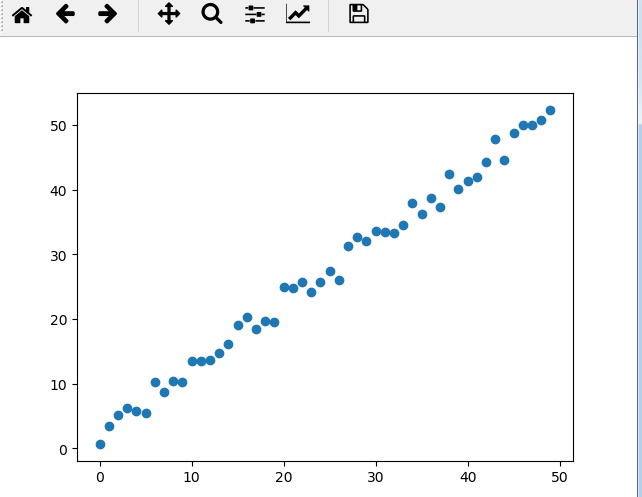
散点图:
# -*- coding: utf-8 -*-
import numpy as np
import matplotlib.pyplot as plt

if __name__ == '__main__':
print "--------------散点图--------------"
x = np.arange(50)
print x
y = x + 5* np.random.rand(50)
plt.scatter(x, y)
plt.show()
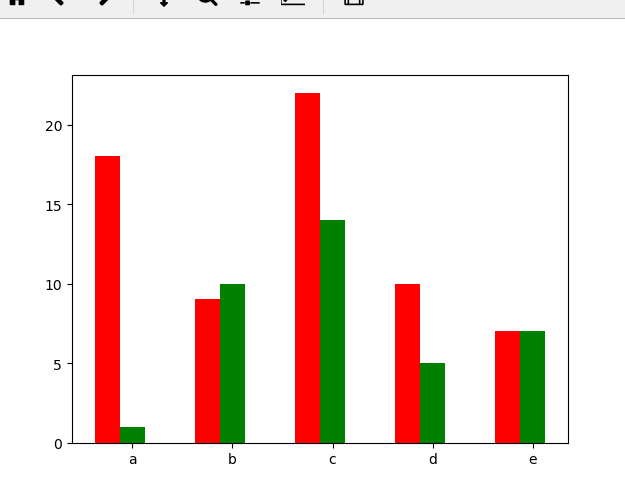
柱状图:
# -*- coding: utf-8 -*-
import numpy as np
import matplotlib.pyplot as plt

if __name__ == '__main__':
x= np.arange(5)
y1, y2 = np.random.randint(1, 25, size=(2, 5))
width = 0.25
ax =plt.subplot(1, 1, 1)
ax.bar(x, y1, width, color='r')
ax.bar(x+width, y2, width, color='g')
ax.set_xticks(x+width)
ax.set_xticklabels(['a','b','c','d','e'])
plt.show()
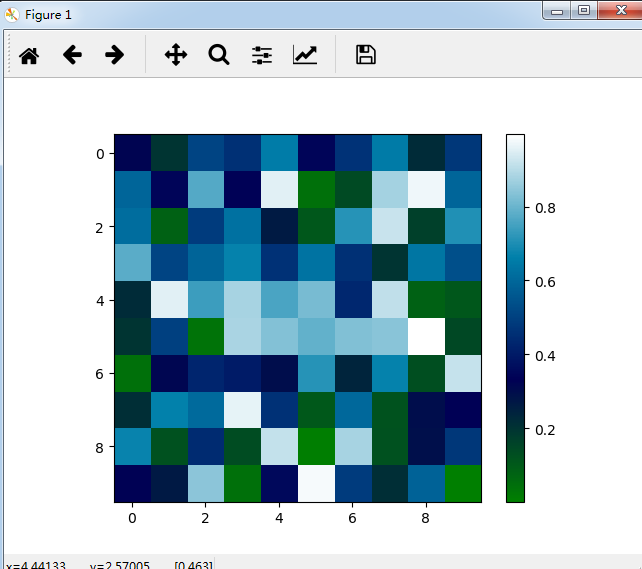
矩阵绘图
# -*- coding: utf-8 -*-
import numpy as np
import matplotlib.pyplot as plt

if __name__ == '__main__':
m = np.random.rand(10, 10)
plt.imshow(m, interpolation='nearest', cmap=plt.cm.ocean)
plt.colorbar()
plt.show()

相关文章推荐
- python-框架-网页爬虫-文本处理-科学计算-可视化-机器学习-数据挖掘-深度学习
- python科学计算数据可视化模块-seaborn
- Python 网页爬虫 & 文本处理 & 科学计算 & 机器学习 & 数据挖掘兵器谱
- 动态可视化 数据可视化之魅D3,Processing,pandas数据分析,科学计算包Numpy,可视化包Matplotlib,Matlab语言可视化的工作,Matlab没有指针和引用是个大问题
- python 科学计算学习一:numpy快速处理数据(3)
- Python 网页爬虫 & 文本处理 & 科学计算 & 机器学习 & 数据挖掘兵器谱
- Python 网页爬虫 & 文本处理 & 科学计算 & 机器学习 & 数据挖掘兵器谱
- Python 网页爬虫 & 文本处理 & 科学计算 & 机器学习 & 数据挖掘兵器谱
- Python 网页爬虫 & 文本处理 & 科学计算 & 机器学习 & 数据挖掘兵器谱 - 数客
- Python 网页爬虫 & 文本处理 & 科学计算 & 机器学习 & 数据挖掘兵器谱
- Python 网页爬虫 & 文本处理 & 科学计算 & 机器学习 & 数据挖掘兵器谱
- python 科学计算学习一:numpy快速处理数据(1)
- Python 网页爬虫 & 文本处理 & 科学计算 & 机器学习 & 数据挖掘兵器谱
- Python 网页爬虫、 文本处理、 科学计算 、机器学习、数据挖掘 兵器谱
- Python 网页爬虫 & 文本处理 & 科学计算 & 机器学习 & 数据挖掘兵器谱 - 数客
- Python 网页爬虫 & 文本处理 & 科学计算 & 机器学习 & 数据挖掘兵器谱
- Python 网页爬虫 & 文本处理 & 科学计算 & 机器学习 & 数据挖掘兵器库
- Python 网页爬虫 & 文本处理 & 科学计算 & 机器学习 & 数据挖掘兵器谱
- python 科学计算学习一:numpy快速处理数据(3)
- Python 网页爬虫 & 文本处理 & 科学计算 & 机器学习 & 数据挖掘兵器谱