Python中,matplotlib绘图无法显示中文的问题
2017-12-08 10:18
901 查看
在python中,默认情况下是无法显示中文的,如下代码:import matplotlib.pyplot as plt
# 定义文本框和箭头格式
decisionNode = dict(boxstyle = "sawtooth", fc = "0.8")
leafNode = dict(boxstyle = "round4", fc = "0.8")
arrow_args = dict(arrowstyle = "<-")
# 绘制带箭头的注解
def plotNode(nodeTxt, centerPt, parentPt, nodeType) :
createPlot.ax1.annotate(nodeTxt, xy = parentPt, xycoords = 'axes fraction', xytext = centerPt, textcoords = 'axes fraction', va = 'center', ha = 'center', bbox = nodeType, arrowprops = arrow_args)
def createPlot() :
fig = plt.figure(1, facecolor='white')
fig.clf()
createPlot.ax1 = plt.subplot(111, frameon = False)
plotNode(U'决策节点', (0.5, 0.1), (0.1, 0.5), decisionNode)
plotNode(U'叶节点', (0.8, 0.1), (0.3, 0.8), leafNode)
plt.show()
createPlot()
得到图像如下:
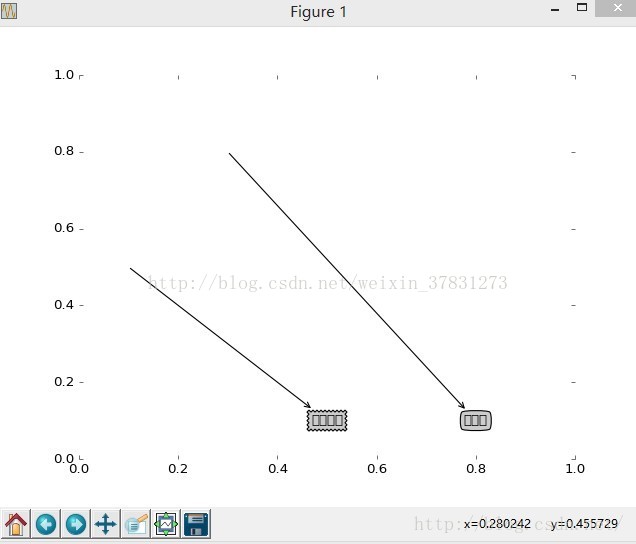
产生中文乱码的原因就是字体的默认设置中并没有中文字体,所以我们只要手动添加中文字体的名称就可以了
手动增加如下代码
from pylab import *
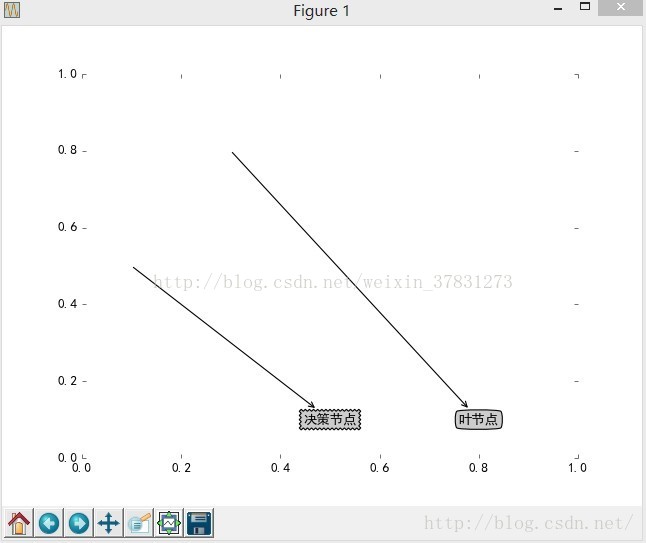
mpl.rcParams['font.sans-serif'] = ['SimHei'] 源代码修改如下:
# 定义文本框和箭头格式
decisionNode = dict(boxstyle = "sawtooth", fc = "0.8")
leafNode = dict(boxstyle = "round4", fc = "0.8")
arrow_args = dict(arrowstyle = "<-")
# 绘制带箭头的注解
def plotNode(nodeTxt, centerPt, parentPt, nodeType) :
createPlot.ax1.annotate(nodeTxt, xy = parentPt, xycoords = 'axes fraction', xytext = centerPt, textcoords = 'axes fraction', va = 'center', ha = 'center', bbox = nodeType, arrowprops = arrow_args)
def createPlot() :
fig = plt.figure(1, facecolor='white')
fig.clf()
createPlot.ax1 = plt.subplot(111, frameon = False)
plotNode(U'决策节点', (0.5, 0.1), (0.1, 0.5), decisionNode)
plotNode(U'叶节点', (0.8, 0.1), (0.3, 0.8), leafNode)
plt.show()
createPlot()
得到图像如下:
产生中文乱码的原因就是字体的默认设置中并没有中文字体,所以我们只要手动添加中文字体的名称就可以了
手动增加如下代码
from pylab import *
mpl.rcParams['font.sans-serif'] = ['SimHei'] 源代码修改如下:
import matplotlib.pyplot as plt

from pylab import *
mpl.rcParams['font.sans-serif'] = ['SimHei']

# 定义文本框和箭头格式
decisionNode = dict(boxstyle = "sawtooth", fc = "0.8")
leafNode = dict(boxstyle = "round4", fc = "0.8")
arrow_args = dict(arrowstyle = "<-")

# 绘制带箭头的注解
def plotNode(nodeTxt, centerPt, parentPt, nodeType) :
createPlot.ax1.annotate(nodeTxt, xy = parentPt, xycoords = 'axes fraction', xytext = centerPt, textcoords = 'axes fraction', va = 'center', ha = 'center', bbox = nodeType, arrowprops = arrow_args)

def createPlot() :
fig = plt.figure(1, facecolor='white')
fig.clf()
createPlot.ax1 = plt.subplot(111, frameon = False)
plotNode(U'决策节点', (0.5, 0.1), (0.1, 0.5), decisionNode)
plotNode(U'叶节点', (0.8, 0.1), (0.3, 0.8), leafNode)
plt.show()
createPlot()
最终得到图像

相关文章推荐
- Python 中,matplotlib绘图无法显示中文的问题
- Python使用matplotlib绘图无法显示中文问题的解决方法
- Python 中,matplotlib绘图无法显示中文的问题
- Python 中,matplotlib绘图无法显示中文的问题
- python中matplotlib绘图中文显示问题
- 解决python中matplotlib绘图中文显示问题
- 解决mac上matplotlib(plot)无法显示中文的问题 (Python)
- python中matplotlib绘图中文显示问题
- python中matplotlib绘图中文显示问题
- python中matplotlib绘图中文显示问题
- Python绘图问题:Matplotlib中如何正确显示中文
- python中matplotlib绘图中文显示问题
- python matplotlib绘图时图例显示问题
- 解决python27 matplotlib 中文不显示问题
- python matplotlib绘图时图例显示问题
- 解决python27 matplotlib 中文不显示问题
- 解决matplotlib绘图中显示中文乱码的问题
- 【Python开发】matplotlib绘图不显示问题解决plt.show()
- Linux下python matplotlib.pyplot在图像上显示中文的问题
- python matplotlib绘图时图例显示问题