MIT-BIH ECG 心电数据+matlab绘图详解
2017-11-30 16:08
489 查看
本篇是为了补充MIT-BIH ECG 心电数据的下载和读取图解这篇博客,为大家提供方便。
该篇比较“久远”,所以网站的内容稍微有些改变,参见:
https://www.physionet.org/cgi-bin/atm/ATM
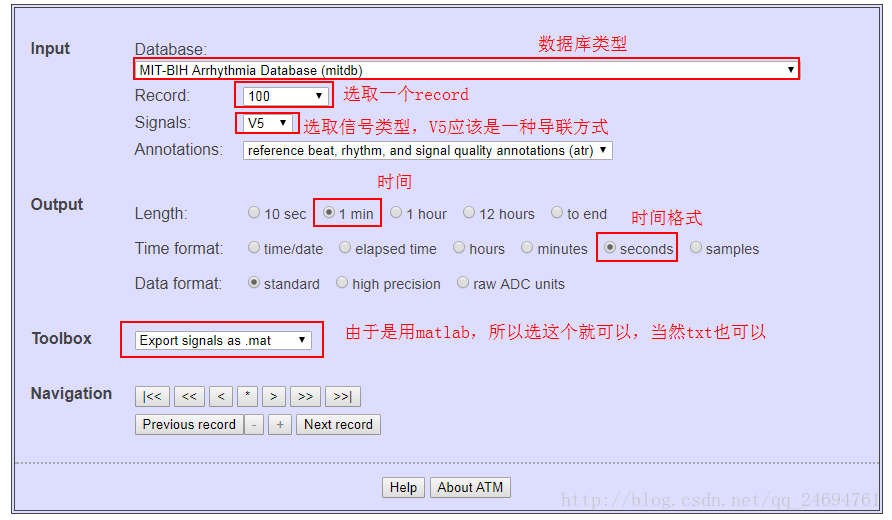
(1)新网站可以直接导出.mat文件,供matlab或Octave使用,以下图为例(当然你也可以尝试其他的内容):
(2)选中后下载相关文件即可:
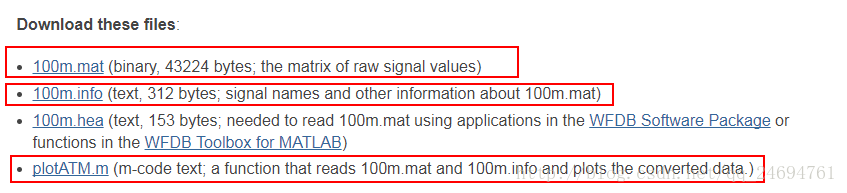
mat文件当然是数据;
infor里面有储存的信息,如果仅仅有mat文件显然是不行的,因为mat中的数据后面还要处理一下(除非你不想以mV为纵坐标的单位。。)
注释后的matlab代码:
整个操作其实超级简单,程序也不复杂,数据处理也不复杂,但大概大家缺的应该是资源获取的途径吧。
(3)关于ECG后续会有更新(弄点小波分析、频域分析什么的)。。。
(4)代码和数据见:MIT-BIH ECG 心电数据+matlab绘图详解
版权声明:本文为博主原创文章,未经博主允许不得转载。
该篇比较“久远”,所以网站的内容稍微有些改变,参见:
https://www.physionet.org/cgi-bin/atm/ATM
(1)新网站可以直接导出.mat文件,供matlab或Octave使用,以下图为例(当然你也可以尝试其他的内容):
(2)选中后下载相关文件即可:
mat文件当然是数据;
infor里面有储存的信息,如果仅仅有mat文件显然是不行的,因为mat中的数据后面还要处理一下(除非你不想以mV为纵坐标的单位。。)
注释后的matlab代码:
%% usage: plotATM('RECORDm')
% This function reads a pair of files (RECORDm.mat and RECORDm.info) generated
% by 'wfdb2mat' from a PhysioBank record, baseline-corrects and scales the time
% series contained in the .mat file, and plots them.  The baseline-corrected
% and scaled time series are the rows of matrix 'val', and each
% column contains simultaneous samples of each time series.
%
% 'wfdb2mat' is part of the open-source WFDB Software Package available at
%    http://physionet.org/physiotools/wfdb.shtml % If you have installed a working copy of 'wfdb2mat', run a shell command
% such as
%    wfdb2mat -r 100s -f 0 -t 10 >100sm.info
% to create a pair of files ('100sm.mat', '100sm.info') that can be read
% by this function.
%
% The files needed by this function can also be produced by the
% PhysioBank ATM, at
%    http://physionet.org/cgi-bin/ATM %
function h = plotATM(Name)
if nargin == 0
Name = '100m';
end

%% 读取数据
infoName = strcat(Name, '.info');
matName = strcat(Name, '.mat');
Octave = exist('OCTAVE_VERSION');
load(matName);  % 采样值变量的名字为val
fid = fopen(infoName, 'rt');
fgetl(fid);   % 第一行
fgetl(fid);   % 第二行
fgetl(fid);   % 第三行
[freqint] = sscanf(fgetl(fid), 'Sampling frequency: %f Hz  Sampling interval: %f sec');  % 得到采样频率和采样间隔
interval = freqint(2);  % 取采样间隔
fgetl(fid);   % 第五行

if(Octave)  % 一种软件:http://blog.csdn.net/Forlogen/article/details/54425766
for i = 1:size(val, 1)
R = strsplit(fgetl(fid), char(9));
signal{i} = R{2};
gain(i) = str2num(R{3});
base(i) = str2num(R{4});
units{i} = R{5};
end
else
for i = 1:size(val, 1)
Infor = textscan(fgetl(fid),'%d%s%f%f%s','delimiter','\t');
row = Infor{1};
signal{i} = Infor{2};  % 导联名称
gain(i) = Infor{3};    % 增益
base(i) = Infor{4};    % base
units{i} = Infor{5};   % 单位
end
end

fclose(fid);

%% 数据处理并作图
val(val==-32768) = NaN;
for i = 1:size(val, 1)
val(i, :) = (val(i, :) - base(i)) / gain(i);  % 转化为mV
end
x = (1:size(val, 2)) * interval; % 采样时间
plot(x', val');
for i = 1:length(signal)
labels{i} = strcat(signal{i},'(', units{i},')');
end
if length(signal) == 1
legend(labels{1});
else
legend(labels);
end
xlabel('Time (sec)');
xlim([min(x) max(x)]);  % 设置横坐标
end
整个操作其实超级简单,程序也不复杂,数据处理也不复杂,但大概大家缺的应该是资源获取的途径吧。
(3)关于ECG后续会有更新(弄点小波分析、频域分析什么的)。。。
(4)代码和数据见:MIT-BIH ECG 心电数据+matlab绘图详解
版权声明:本文为博主原创文章,未经博主允许不得转载。

相关文章推荐
- MIT-BIH ECG 心电数据的下载和读取图解
- MIT-BIH ECG 信号的数据读取方法和Matlab程序
- 怎么用MATLAB来读取MIT-BIH的心电数据
- MIT-BIH ECG 心电数据的下载和读取图解(重要!)
- MIT-BIH ECG 信号的数据读取方法和Matlab程序
- MIT-BIH ECG 信号的数据读取方法和Matlab程序
- MIT-BIH ECG 心电数据的下载和读取图解
- MIT-BIH ECG 信号的数据读取方法和Matlab程序
- MIT-BIH Arrhythmia Database 数据下载及matlab处理程序
- MIT-BIH心电数据的下载和读取
- MIT-BIH心率失常数据提取及部分MATLAB程序解释
- MIT-BIH心率失常数据提取及部分MATLAB程序解释
- 图解MIT-BIH数据库心电数据下载和Matlab读取程序
- Matlab(1)-导入MIT-BIH心电头文件(.hea)所用函数
- MATLAB读取mat数据并绘图
- Matlab绘图详解
- VC++与Matlab混合编程之引擎操作详解(6)数据类型mxArray的操作
- Matlab学习笔记 绘图函数详解
- matlab 数据拟后绘图
- Matlab数据可视化(4):一维数据绘图 II