Grafana+Prometheus打造全方位立体监控系统
2017-11-08 19:39
956 查看
前言
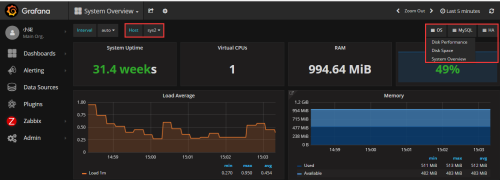
本文主要介绍如何使用Grafana和Prometheus以及node_exporter对Linux服务器性能进行监控。下面两张图分别是两台服务器:服务器A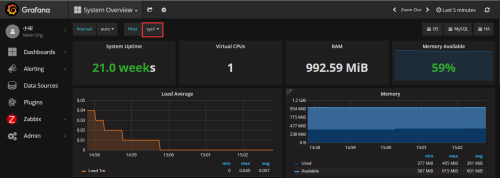
服务器B
概述
Prometheus是一个开源的服务监控系统,它通过HTTP协议从远程的机器收集数据并存储在本地的时序数据库上。多维数据模型(时序列数据由metric名和一组key/value组成)在多维度上灵活的查询语言(PromQl)
不依赖分布式存储,单主节点工作.
通过基于HTTP的pull方式采集时序数据
可以通过push gateway进行时序列数据推送(pushing)
可以通过服务发现或者静态配置去获取要采集的目标服务器
多种可视化图表及仪表盘支持
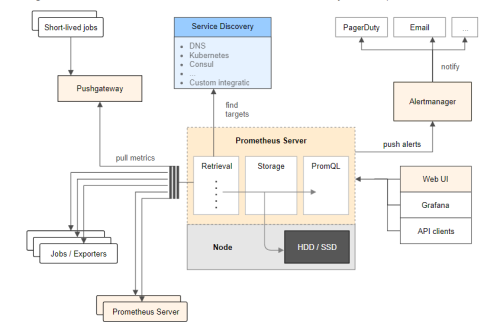
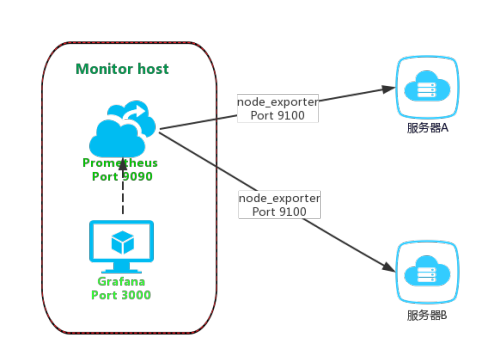
Prometheus通过安装在远程机器上的exporter来收集监控数据,后面我们将使用到node_exporter收集系统数据。架构
Grafana 是一个开箱即用的可视化工具,具有功能齐全的度量仪表盘和图形编辑器,有灵活丰富的图形化选项,可以混合多种风格,支持多个数据源特点。
架构
安装
Exporter
下载并解压:#下载wget https://github.com/prometheus/node_exporter/releases/download/v0.14.0/node_exporter-0.15.0.linux-amd64.tar.gz -O node_exporter-0.15.0.linux-amd64.tar.gz# 可自定义解压目录tar -xvf node_exporter-0.15.0.linux-amd64.tar.gz运行node_exporter:
# 后台运行./node_exporter &
Prometheus
下载地址:https://prometheus.io/download执行以下命令:## 下载wget https://github.com/prometheus/prometheus/releases/download/v2.0.0-rc.3/prometheus-2.0.0-rc.3.linux-amd64.tar.gz## 可自定义解压目录tar -xvf prometheus-2.0.0-rc.3.linux-amd64.tar.gz配置prometheus,vi prometheus.yml
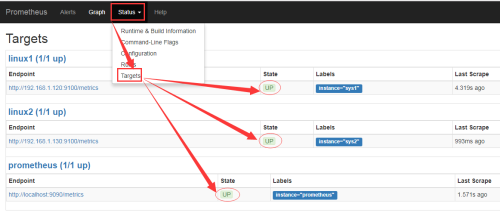
global:
scrape_interval:     15s
evaluation_interval: 15s
- job_name: prometheus
static_configs:
- targets: ['localhost:9090']
labels:
instance: prometheus
- job_name: linux1
static_configs:
- targets: ['192.168.1.120:9100']
labels:
instance: sys1
- job_name: linux2
static_configs:
- targets: ['192.168.1.130:9100']
labels:
instance: sys2
IP对应的是我们内网的服务器,端口则是对应的exporter的监听端口。运行Prometheus
./prometheus level=info ts=2017-11-07T02:39:50.220187934Z caller=main.go:215 msg="Starting Prometheus" version="(version=2.0.0-rc.2, branch=HEAD, revision=ce63a5a8557bb33e2030a7756c58fd773736b592)"level=info ts=2017-11-07T02:39:50.22025258Z caller=main.go:216 build_context="(go=go1.9.1, user=root@a6d2e4a7b8da, date=20171025-18:42:54)"level=info ts=2017-11-07T02:39:50.220270139Z caller=main.go:217 host_details="(Linux 3.10.0-514.16.1.el7.x86_64 #1 SMP Wed Apr 12 15:04:24 UTC 2017 x86_64 iZ2ze74fkxrls31tr2ia2fZ (none))"level=info ts=2017-11-07T02:39:50.223171565Z caller=web.go:380 component=web msg="Start listening for connections" address=0.0.0.0:9090......启动成功以后我们可以通过Prometheus内置了web界面访问,http://ip:9090 ,如果出现以下界面,说明配置成功
Grafana
执行以下安装命令:## 安装依赖grafana运行需要go环境yum install go -y## 安装 grafanayum install https://s3-us-west-2.amazonaws.com/grafana-releases/release/grafana-4.6.1-1.x86_64.rpm -y安装包信息:二进制文件: /usr/sbin/grafana-server
init.d 脚本: /etc/init.d/grafana-server
环境变量文件: /etc/sysconfig/grafana-server
配置文件: /etc/grafana/grafana.ini
启动项: grafana-server.service
日志文件:/var/log/grafana/grafana.log
默认配置的sqlite3数据库:/var/lib/grafana/grafana.db你可以执行以下启动命令:
service grafana-server start启动grafana,并设置开机启动:
systemctl daemon-reloadsystemctl start grafana-serversystemctl status grafana-serversystemctl enable grafana-server.service服务器端图像(PNG)渲染是可选的功能,但在共享可视化时非常有用,例如在警报通知中。
如果图像缺少文本,请确保已安装字体包。
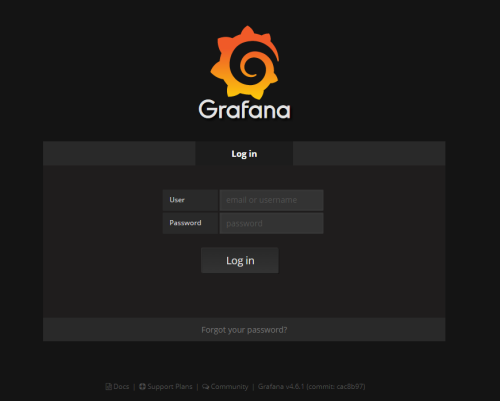
yum install fontconfigyum install freetype*yum install urw-fonts访问Grafana通过Nginx代理,默认登录用户名密码:admin/admin,需及时修改。
server {
listen       80;
server_name  grafana.52itstyle.com;
charset utf-8;
location / {
default_type text/html;
proxy_pass http://127.0.0.1:3000; }
}
编辑配置文件/etc/grafana/grafana.ini ,修改dashboards.json段落下两个参数的值:[dashboards.json]enabled = truepath = /var/lib/grafana/dashboards安装仪表盘JSON模版:
git clone https://github.com/percona/grafana-dashboards.gitcp -r grafana-dashboards/dashboards /var/lib/grafana/最后,通过service grafana-server start命令启动服务,访问地址:http://grafana.52itstyle.com
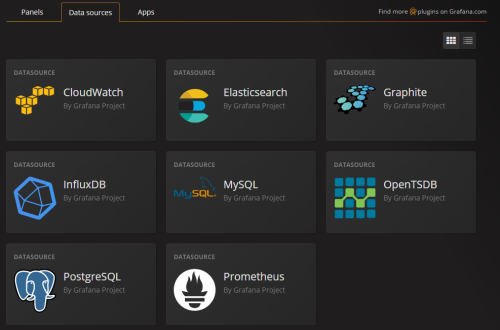
然后在Data Sources选项中添加数据源:
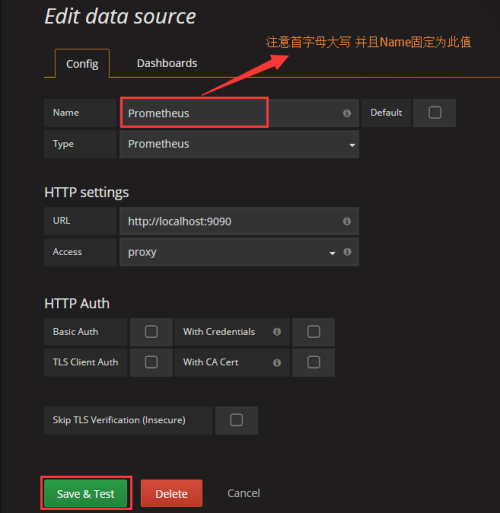
添加成功以后,我们就可以查看到文章开头的效果图了。
总结
讲道理,这一套东西还是很强大的,各种开源组间一整合完美搭建出一套监控系统。当然了以上仅仅是系统的一个监控,Grafana以及exporter组间还可以实现对Nginx、MySql、Redis以及MongDB的检测。参考资料
https://grafana.com/https://prometheus.io/https://github.com/prometheushttps://github.com/prometheus/node_exporterhttps://github.com/percona/grafana-dashboardshttps://www.percona.com/blog/2016/02/29/graphing-mysql-performance-with-prometheus-and-grafana/作者: 小柒出处: https://blog.52itstyle.com分享是快乐的,也见证了个人成长历程,文章大多都是工作经验总结以及平时学习积累,基于自身认知不足之处在所难免,也请大家指正,共同进步。

相关文章推荐
- Grafana+Prometheus打造全方位立体监控系统
- Grafana+Prometheus打造全方位立体监控系统
- 使用 Grafana、collectd 和 InfluxDB 打造现代监控系统
- 使用 Grafana+collectd+InfluxDB 打造现代监控系统
- 使用 Grafana、collectd 和 InfluxDB 打造现代监控系统
- 使用 Grafana+collectd+InfluxDB 打造现代监控系统
- 使用 Grafana、collectd 和 InfluxDB 打造现代监控系统
- 使用 Grafana、collectd 和 InfluxDB 打造现代监控系统
- 使用 Grafana、collectd 和 InfluxDB 打造现代监控系统
- 使用 Grafana、collectd 和 InfluxDB 打造现代监控系统
- 基于Prometheus搭建SpringCloud全方位立体监控体系
- 使用 Grafana、collectd 和 InfluxDB 打造现代监控系统
- 【监控】使用 Grafana、collectd 和 InfluxDB 打造现代监控系统
- 使用 Grafana、collectd 和 InfluxDB 打造现代监控系统
- WIndows下使用Grafana+InfluxDB打造监控系统
- 使用 Grafana+collectd+InfluxDB 打造现代监控系统 2015年03月19日 | 标签: collectd, grafana, influxdb | 作者:vpsee 想打造
- 【转】Windows7打造全方位护眼系统
- 运维自动化之使用PHP+MYSQL+SHELL打造私有监控系统(三)
- 使用StatsD, Graphite, Grafana, Kamon搭建可用于JVM项目的可视化性能监控系统
- 运维自动化之使用PHP+MYSQL+SHELL打造私有监控系统(三)