Python进行数据分析(一)初步学习 对时区进行计数
2017-09-27 20:30
726 查看
time_zones[:10]
Out[19]:
[u'America/New_York',
u'America/Denver',
u'America/New_York',
u'America/Sao_Paulo',
u'America/New_York',
u'America/New_York',
u'Europe/Warsaw',
u'',
u'',
u'']
接下来对时区进行计数,这里使用两种方法,一种使用Python标准库,另一个比较简(使用pandas)。
def get_counts(sequence):
counts = {}
for x in sequence:
if x in counts:
counts[x] += 1
else:
counts[x] = 1
return counts

get_counts(time_zones[:10])
Out[21]:
{u'': 3,
u'America/Denver': 1,
u'America/New_York': 4,
u'America/Sao_Paulo': 1,
u'Europe/Warsaw': 1}
使用标准款,简洁版
from collections import defaultdict

def get_counts2(sequence):
counts = defaultdict(int) # 所有的值均会被初始化为0
for x in sequence:
counts[x] += 1
return counts

get_counts2(time_zones[:10])
Out[24]: defaultdict(<type 'int'>, {u'Europe/Warsaw': 1, u'America/Denver': 1, u'America/Sao_Paulo': 1, u'': 3, u'America/New_York': 4})
要它对时区进行处理,传入time_zones传入即可:
counts = get_counts(time_zones)

counts['America/New_York']
Out[27]: 1251

len(time_zones)
Out[28]: 3440
得到前10位的时区及计数值:
def top_counts(count_dict, n = 10):
value_key_pairs = [(count,tz) for tz,count in count_dict.items()]
value_key_pairs.sort()
return value_key_pairs[-n:]        # 得到倒数第n个数到最后

top_counts(counts)
Out[30]:
[(33, u'America/Sao_Paulo'),
(35, u'Europe/Madrid'),
(36, u'Pacific/Honolulu'),
(37, u'Asia/Tokyo'),
(74, u'Europe/London'),
(191, u'America/Denver'),
(382, u'America/Los_Angeles'),
(400, u'America/Chicago'),
(521, u''),
(1251, u'America/New_York')]
使用collection.Counter类,使这个任务变的简单:
from collections import Counter

counts = Counter(time_zones)

counts.most_common(10)
Out[33]:
[(u'America/New_York', 1251),
(u'', 521),
(u'America/Chicago', 400),
(u'America/Los_Angeles', 382),
(u'America/Denver', 191),
(u'Europe/London', 74),
(u'Asia/Tokyo', 37),
(u'Pacific/Honolulu', 36),
(u'Europe/Madrid', 35),
(u'America/Sao_Paulo', 33)]
DataFrame是pandas中最重要的数据结构,用于将数据表示为一个表格。从一组数据中创建DataFrame:
from pandas import DataFrame, Series

import pandas as pd; import numpy as np

frame = DataFrame(records)

frame
Out[38]:
frame['tz'][:10]
Out[40]:
0     America/New_York
1       America/Denver
2     America/New_York
3    America/Sao_Paulo
4     America/New_York
5     America/New_York
6        Europe/Warsaw
7
8
9
Name: tz, dtype: object
这里frame的输出形式是摘要视图,主要用于较大的DataFrame对象。frame['tz']所返回的Series对象有一个value_counts方法,改方法可以让我们得到所需的信息:
tz_counts = frame['tz'].value_counts()

tz_counts[:10]
Out[42]:
America/New_York       1251
521
America/Chicago         400
America/Los_Angeles     382
America/Denver          191
Europe/London            74
Asia/Tokyo               37
Pacific/Honolulu         36
Europe/Madrid            35
America/Sao_Paulo        33
dtype: int64
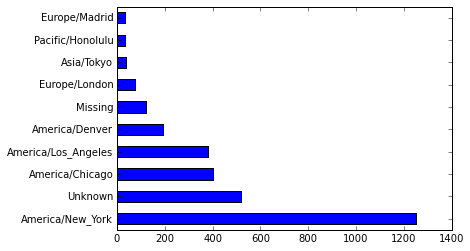
利用绘图库(matplotlib)为这段数据生成一张的图片。
为此,先给记录中未知或缺失的时区填上一个替代值。fillna函数可以替代缺失值(NA),而未知值(空字符串)则可通过 布尔型数组索引加以替换:
clean_tz = frame['tz'].fillna('Missing')  # 替换缺失值(NA)

clean_tz[clean_tz == ''] = 'Unknown'      # 未知值通过布尔型数组索引加以替换,注意这里的 clean_tz是 Series对象

tz_counts = clean_tz.value_counts()

tz_counts[:10]
Out[46]:
America/New_York       1251
Unknown                 521
America/Chicago         400
America/Los_Angeles     382
America/Denver          191
Missing                 120
Europe/London            74
Asia/Tokyo               37
Pacific/Honolulu         36
Europe/Madrid            35
dtype: int64
tz_counts[:10].plot(kind='barh', rot=0) Out[52]: <matplotlib.axes._subplots.AxesSubplot at 0xf6de430>
results = Series([x.split()[0] for x in frame.a.dropna()])

results[:5]
Out[65]:
0               Mozilla/5.0
1    GoogleMaps/RochesterNY
2               Mozilla/4.0
3               Mozilla/5.0
4               Mozilla/5.0
dtype: object

results.value_counts()[:8]
Out[66]:
Mozilla/5.0                 2594
Mozilla/4.0                  601
GoogleMaps/RochesterNY       121
Opera/9.80                    34
TEST_INTERNET_AGENT           24
GoogleProducer                21
Mozilla/6.0                    5
BlackBerry8520/5.0.0.681       4
dtype: int64
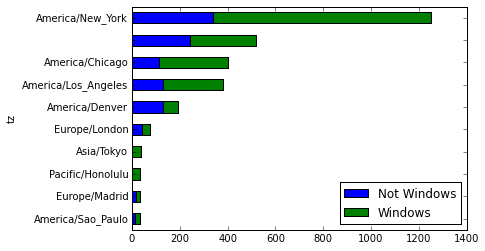
按Windows和非Windows用户对时区统计信息进行分解。
由于有agent缺失值,首先将他们从数据中移除:
cframe = frame[frame.a.notull()]
根据a值计算出各行是否是Windows:
根据时区和新得到的操作系统列表对数据进行分组
通过size对分组结果进行计数(类似上面value_counts()),并用unstack()对计数结果进行重塑:
operating_system = np.where(cframe['a'].str.contains('Windows'),
'Windows', 'Not Windows')

operating_system[:5]
Out[79]:
array(['Windows', 'Not Windows', 'Windows', 'Not Windows', 'Windows'],
dtype='|S11')

by_tz_os = cframe.groupby(['tz', operating_system])

by_tz_os
Out[81]: <pandas.core.groupby.DataFrameGroupBy object at 0x0F9C4D30>

agg_counts = by_tz_os.size().unstack().fillna(0)        # 拆分列

agg_counts[:10]
Out[83]:
Not Windows  Windows
tz
245      276
Africa/Cairo                              0        3
Africa/Casablanca                         0        1
Africa/Ceuta                              0        2
Africa/Johannesburg                       0        1
Africa/Lusaka                             0        1
America/Anchorage                         4        1
America/Argentina/Buenos_Aires            1        0
America/Argentina/Cordoba                 0        1
America/Argentina/Mendoza                 0        1
没有拆分列是这种效果(unstack):
Out[87]:
tz
Not Windows    245
Windows        276
Africa/Cairo       Windows          3
Africa/Casablanca  Windows          1
Africa/Ceuta       Windows          2
dtype: int64
# 用于按升序排列
# 行相加(win+nowin之和,排序),返回数值从小到大的索引值
indexer = agg_counts.sum(1).argsort()

indexer[:10]
Out[90]:
tz
24
Africa/Cairo                      20
Africa/Casablanca                 21
Africa/Ceuta                      92
Africa/Johannesburg               87
Africa/Lusaka                     53
America/Anchorage                 54
America/Argentina/Buenos_Aires    57
America/Argentina/Cordoba         26
America/Argentina/Mendoza         55
dtype: int64
通过take,截取了最后10行:(根据索引截取数据)
count_subset = agg_counts.take(indexer)[-10:]

count_subset
Out[97]:
Not Windows  Windows
tz
America/Sao_Paulo             13       20
Europe/Madrid                 16       19
Pacific/Honolulu               0       36
Asia/Tokyo                     2       35
Europe/London                 43       31
America/Denver               132       59
America/Los_Angeles          130      252
America/Chicago              115      285
245      276
America/New_York             339      912
生成一张条形图,使用stacked=True 来生成一张堆积条形图
count_subset.plot(kind='barh', stacked=True)
Out[98]: <matplotlib.axes._subplots.AxesSubplot at 0xfd535f0>
将各行规划化为“总计为1”,并重新绘图
normed_subset = count_subset.div(count_subset.sum(1), axis=0)

normed_subset.plot(kind='barh', stacked=True)
Out[100]: <matplotlib.axes._subplots.AxesSubplot at 0xfd53990>


相关文章推荐
- 转载]利用Python进行数据分析——绘图和可视化 xticks-学习笔记
- 『利用Python进行数据分析学习』第四章:numpy基础学习
- 《利用Python进行数据分析: Python for Data Analysis 》学习随笔
- 【利用python进行数据分析】附录A Python 学习
- 学习笔记:利用Python进行数据分析
- 利用python进行数据分析(O'Relly)学习笔记
- 利用Pythonj进行数据分析学习笔记——第五章 pandas入门
- 利用python进行数据分析(学习笔记)
- 利用Python进行数据分析 学习笔记
- Python: 利用Python进行数据分析 学习记录
- 【利用python进行数据分析-学习记录】python-matplotlib中Basemap插件的安装
- python学习-文本数据分析2(文本分类)
- 快速学习 Python 数据分析包 之 pandas
- Comprehensive learning path – Data Science in Python深度学习路径-用python进行数据学习
- [python和大数据-1]利用爬虫登录知乎进行BFS搜索抓取用户信息本地mysql分析【PART1】
- 利用python进行数据分析之数据加载存储与文件格式
- linux下利用python进行数据分析(1)Anaconda 安装
- python学习-文本数据分析1(主题提取+词向量化)
- 利用Python进行数据分析--数据加载、存储与文件格式
- python学习-数据分析2(分类型数据处理+SVM建模)