用Python的Matplotlib模块进行基本的图像操作
2017-09-13 22:16
781 查看
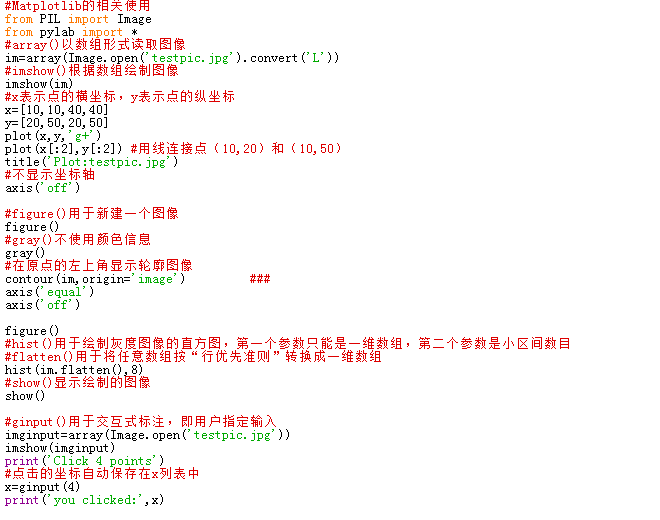
#Matplotlib的相关使用
from PIL import Image
from pylab import *
#array()以数组形式读取图像
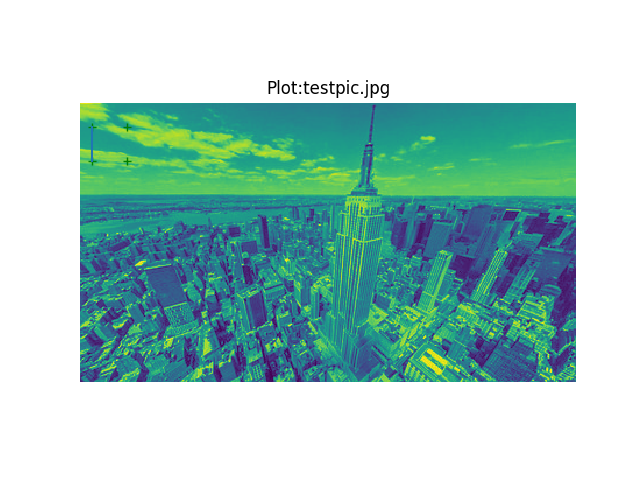
im=array(Image.open('testpic.jpg').convert('L'))
#imshow()根据数组绘制图像
imshow(im)
#x表示点的横坐标,y表示点的纵坐标
x=[10,10,40,40]
y=[20,50,20,50]
plot(x,y,'g+')
plot(x[:2],y[:2]) #用线连接点(10,20)和(10,50)
title('Plot:testpic.jpg')
#不显示坐标轴
axis('off')
原图:

均衡化图像:
____________________________________________________
#figure()用于新建一个图像
figure()
#gray()不使用颜色信息
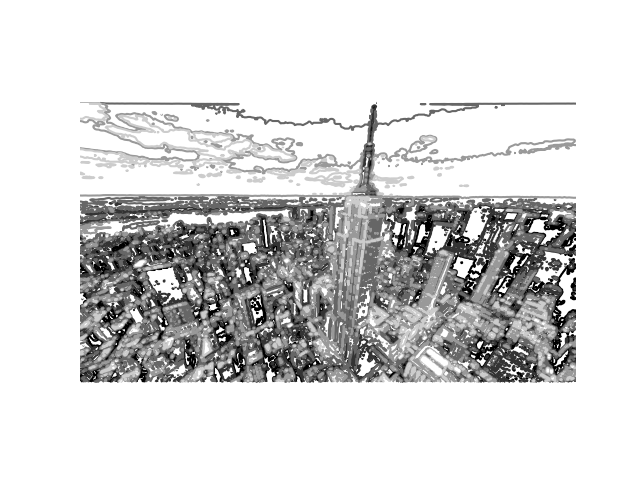
gray()
#在原点的左上角显示轮廓图像
contour(im,origin='image') ###
axis('equal')
axis('off')
轮廓图:
——————————————————————————————
figure()
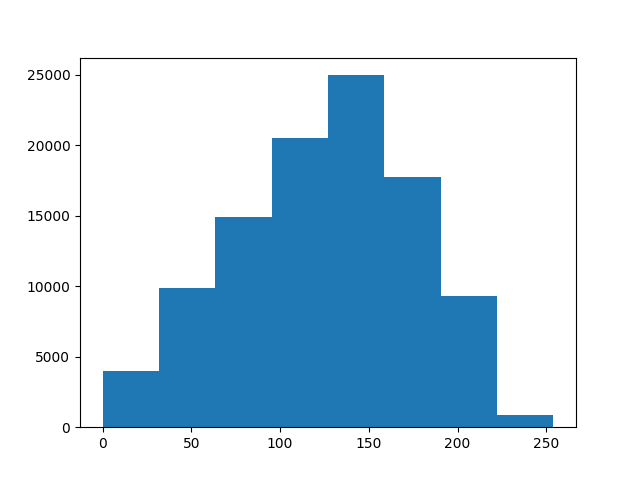
#hist()用于绘制灰度图像的直方图,第一个参数只能是一维数组,第二个参数是小区间数目
#flatten()用于将任意数组按“行优先准则”转换成一维数组
hist(im.flatten(),8)
#show()显示绘制的图像
show()
直方图:
——————————————————————————————
#ginput()用于交互式标注,即用户指定输入
imginput=array(Image.open('testpic.jpg'))
imshow(imginput)
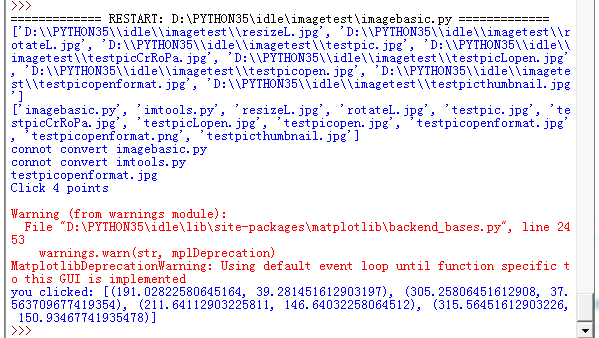
print('Click 4 points')
#点击的坐标自动保存在x列表中
x=ginput(4)
print('you clicked:',x)
from PIL import Image
from pylab import *
#array()以数组形式读取图像
im=array(Image.open('testpic.jpg').convert('L'))
#imshow()根据数组绘制图像
imshow(im)
#x表示点的横坐标,y表示点的纵坐标
x=[10,10,40,40]
y=[20,50,20,50]
plot(x,y,'g+')
plot(x[:2],y[:2]) #用线连接点(10,20)和(10,50)
title('Plot:testpic.jpg')
#不显示坐标轴
axis('off')
原图:
均衡化图像:
____________________________________________________
#figure()用于新建一个图像
figure()
#gray()不使用颜色信息
gray()
#在原点的左上角显示轮廓图像
contour(im,origin='image') ###
axis('equal')
axis('off')
轮廓图:
——————————————————————————————
figure()
#hist()用于绘制灰度图像的直方图,第一个参数只能是一维数组,第二个参数是小区间数目
#flatten()用于将任意数组按“行优先准则”转换成一维数组
hist(im.flatten(),8)
#show()显示绘制的图像
show()
直方图:
——————————————————————————————
#ginput()用于交互式标注,即用户指定输入
imginput=array(Image.open('testpic.jpg'))
imshow(imginput)
print('Click 4 points')
#点击的坐标自动保存在x列表中
x=ginput(4)
print('you clicked:',x)

相关文章推荐
- Python数据可视化图像库MatPlotLib基本图像操作
- 【基本图像操作】Matplotlib
- 用Python的PIL模块进行基本的图像操作
- Python使用matplotlib模块绘制图像并设置标题与坐标轴等信息示例
- Python-Matplotlib绘制简单图像
- ImportError: No module named matplotlib.pyplot安装模块python
- python绘图模块matplotlib
- Python matplotlib 模块安装全解
- Python之matplotlib和pandas 模块安装
- 获取博客积分排名,存入数据库,读取数据进行绘图(python,selenium,matplotlib)
- 【图像处理】Python-Image模块基本的图像处理操作
- 在python2.7.X中怎么安装numpy scipymatplotlib pandas等模块
- python中引用matplotlib画图的几个常用命令及基本步骤
- Python模块简介及安装 [numpy,pandas,matplotlib,scipy,statsmodels,Gensim,sklearn,keras]
- 【python笔记】使用matplotlib,pylab进行python绘图
- 基于 Python Matplotlib 模块的高质量图形输出
- python matplotlib模块
- 压力测试监控数据通过python matplotlib进行可视化
- ImportError: No module named matplotlib.pyplot安装模块python
- python导入matplotlib模块出错