数据分析python应用到的ggplot(二)
2017-09-12 02:02
477 查看
还是优达学院的第七课
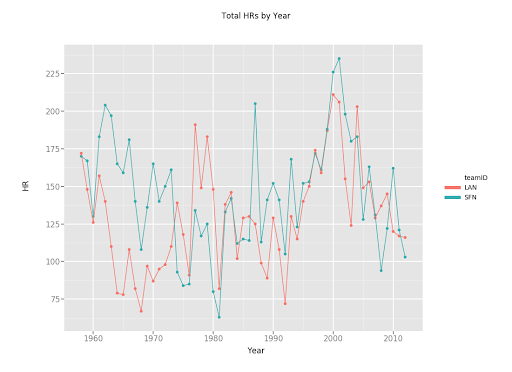
数据:https://s3.amazonaws.com/content.udacity-data.com/courses/ud359/hr_by_team_year_sf_la.csv
ggplot:
图形:
easy learnning:
图形:
数据:https://s3.amazonaws.com/content.udacity-data.com/courses/ud359/hr_by_team_year_sf_la.csv
ggplot:
gp = pandas.read_csv(hr_by_team_year_sf_la_csv)
gg =  ggplot(gp,aes('yearID','HR',color = 'teamID')) + geom_point() + geom_line() + ggtitle('Total HRs by Year') + xlab('Year') +ylab('HR')
图形:
easy learnning:
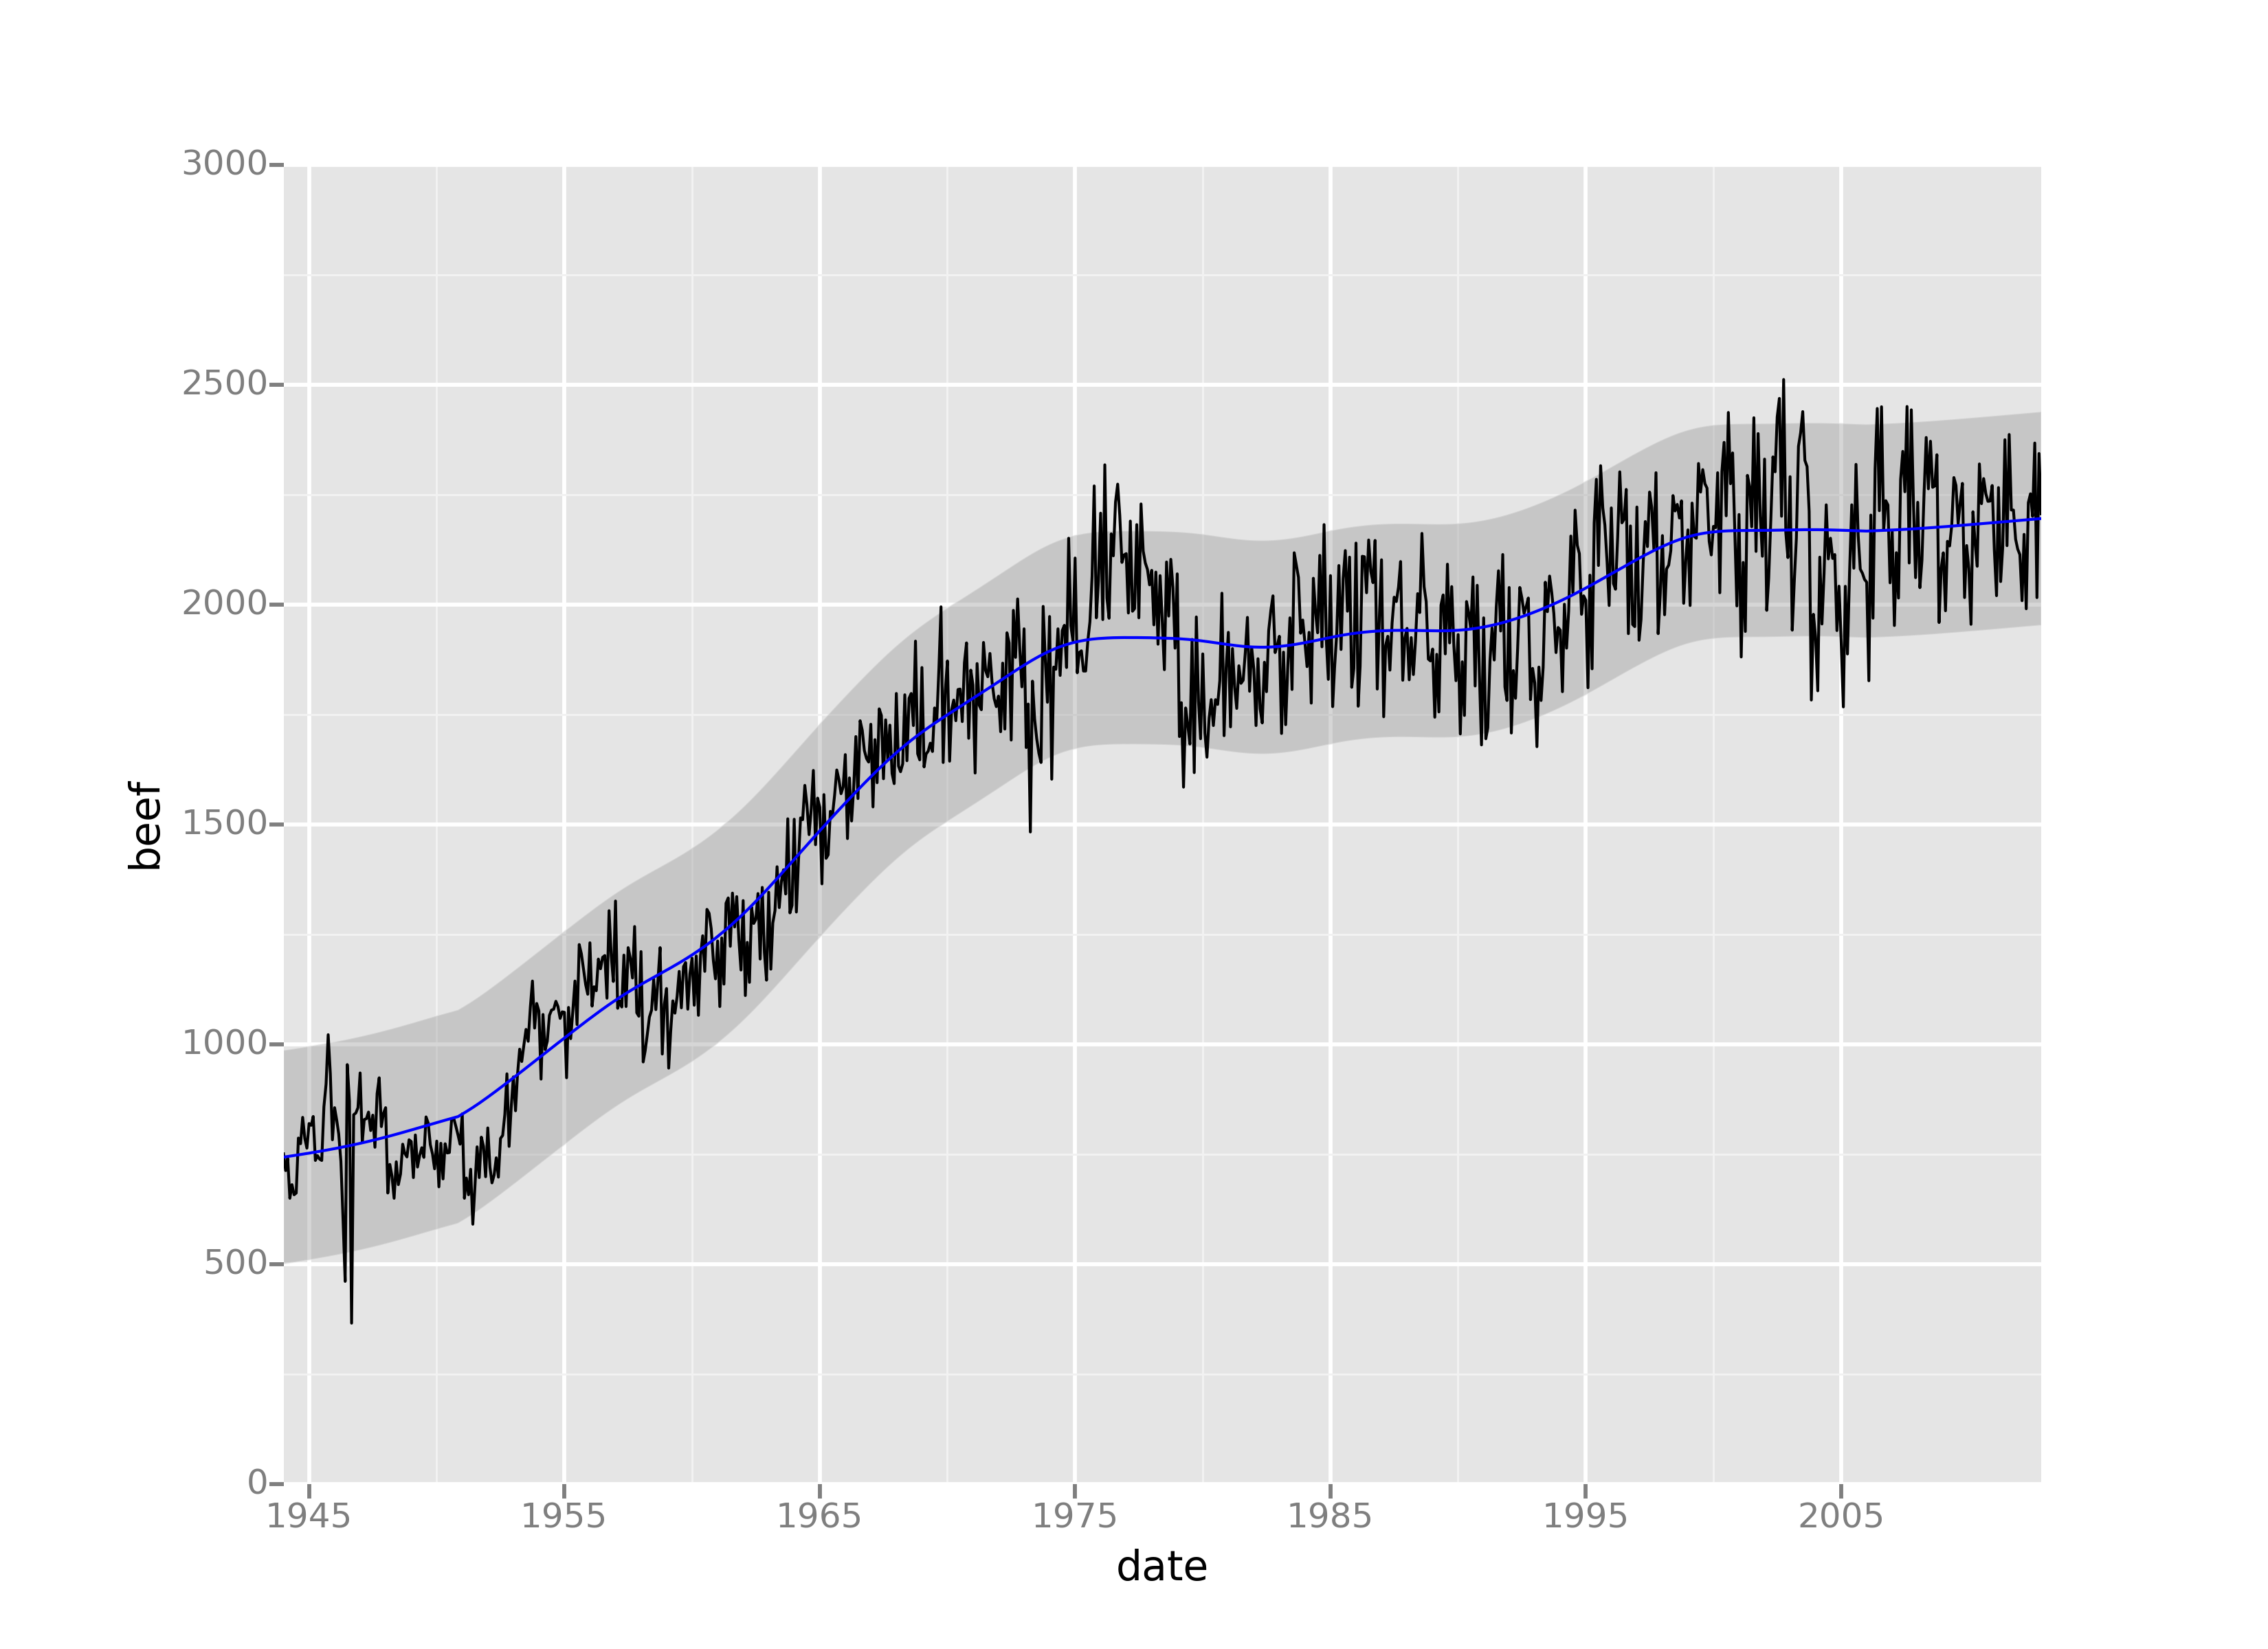
from ggplot import *
ggplot(aes(x='date',y='beef'),data=meat)+geom_line()+stat_smooth(colour='blue', span=0.2)
图形:

相关文章推荐
- 数据分析python应用到的ggplot
- 在用python数据分析时一些应用
- 学习Python数据分析随手笔记【一】numpy数组的函数简单应用
- Python 数据分析(二 本实验将学习利用 Python 数据聚合与分组运算,时间序列,金融与经济数据应用等相关知识
- Python 数据分析(二 本实验将学习利用 Python 数据聚合与分组运算,时间序列,金融与经济数据应用等相关知识
- 用 python 做数据分析:pandas 的 excel 应用初探
- Python编程及应用--数据分析与科学计算可视化培训班
- 利用python进行数据分析-NumPy高级应用
- Python数据采集处理分析挖掘可视化应用实例
- 拉格朗日插值法在数据分析中的应用——Python插值scimpy,lagrange
- python数据分析之pandas库的DataFrame应用二
- Python在金融,数据分析,和人工智能中的应用
- 利用python进行数据分析之pandas库的应用(二)
- Python金融应用编程(数据分析、定价与量化投资)
- Python金融应用编程(数据分析、定价与量化投资)
- 利用python进行数据分析之pandas库的应用(一)
- python数据分析之pandas库的Series应用
- 用 python 做数据分析:pandas 的 excel 应用初探
- python数据分析之pandas库的DataFrame应用一
- 【Python数据分析】四级成绩分布 -matplotlib,xlrd 应用