python机器学习及实战-Python基础综合实践
2017-09-09 21:47
387 查看
#读取数据
import pandas as pd
df_train = pd.read_csv('breast-cancer-train.csv')
df_test = pd.read_csv('breast-cancer-test.csv')
#print(df_train.info())
#print(df_test.info())
df_test_negative = df_test.loc[df_test['Type'] == 0][['Clump Thickness', 'Cell Size']]#将Type这一列值等于0的行的Clump Thickness,Cell Size列取出来,有点拗口
df_test_positive = df_test.loc[df_test['Type'] == 1][['Clump Thickness', 'Cell Size']]#将Type这一列值等于1的行的Clump Thickness,Cell Size列取出来
#print(df_test_negative)
#print(df_test_positive)
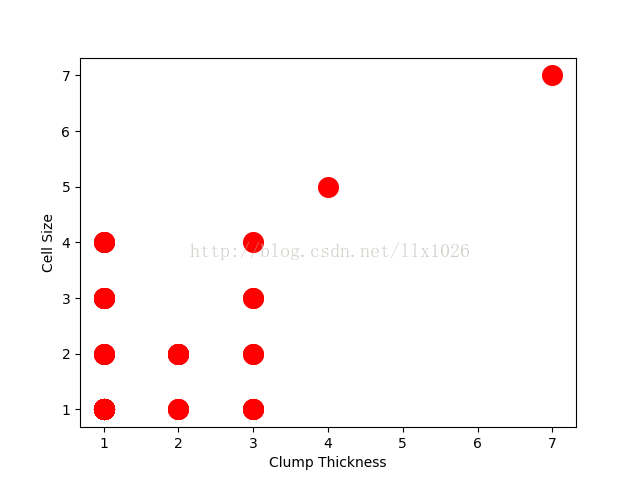
#绘制散点图1
import matplotlib.pyplot as plt
plt.scatter(df_test_negative['Clump Thickness'], df_test_negative['Cell Size'], marker = 'o', s = 200, c = 'red')
plt.xlabel('Clump Thickness')
plt.ylabel('Cell Size')
plt.show()
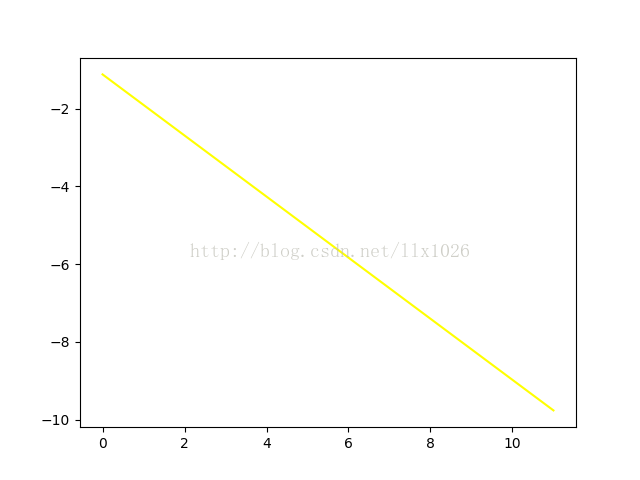
#绘制二维直线图2
import numpy as np
intercept = np.random.random([1])
coef = np.random.random([2])
lx=np.arange(0, 12)
ly = (-intercept - lx * coef[0]) / coef[1]
plt.plot(lx, ly, c='yellow')
plt.show()
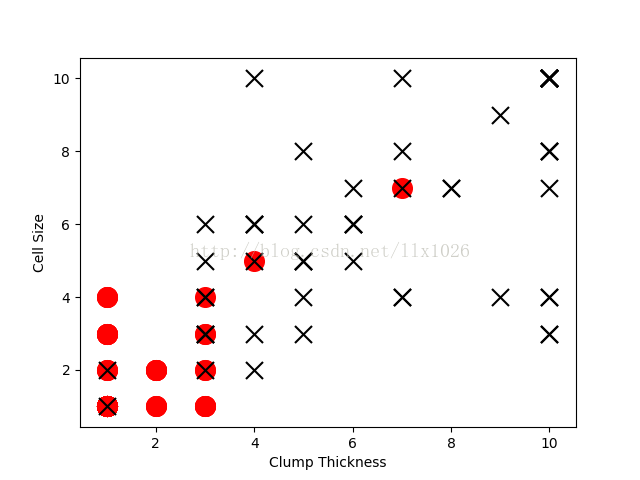
#测试样本正样本和负样本散点图图3
plt.scatter(df_test_negative['Clump Thickness'], df_test_negative['Cell Size'], marker = 'o', s = 200, c = 'red')
plt.scatter(df_test_positive['Clump Thickness'], df_test_positive['Cell Size'], marker = 'x', s = 150, c = 'black')
plt.xlabel('Clump Thickness')
plt.ylabel('Cell Size')
plt.show()
#训练样本前十行训练的线性分类器图4
from sklearn.linear_model import LogisticRegression
lr = LogisticRegression()
lr.fit(df_train[['Clump Thickness', 'Cell Size']][:10], df_train['Type'][:10])#采用训练样本的前十行进行训练
#print(df_train[['Clump Thickness', 'Cell Size']][:10])
#print(df_train['Type'][:10])
print('Testing accuracy (10 training samples):', lr.score(df_test[['Clump Thickness', 'Cell Size']], df_test['Type']))
intercept = lr.intercept_
coef = lr.coef_[0, :]
ly = (-intercept - lx * coef[0]) / coef[1]
plt.plot(lx, ly, c = 'green')
plt.scatter(df_test_negative['Clump Thickness'], df_test_negative['Cell Size'], marker = 'o', s = 200, c = 'red')
plt.scatter(df_test_positive['Clump Thickness'], df_test_positive['Cell Size'], marker = 'x', s = 200, c = 'black')
plt.xlabel('Clump Thickness')
plt.ylabel('Cell Size')
plt.show()
#所有样本训练的线性分类器图5
lr = LogisticRegression()
lr.fit(df_train[['Clump Thickness', 'Cell Size']], df_train['Type'])#采用所有训练样本进行训练
print('Testing accuracy (all traning samples):', lr.score(df_test[['Clump Thickness', 'Cell Size']], df_test['Type']))
intercept = lr.intercept_
coef = lr.coef_[0, :]
ly = (-intercept - lx * coef[0]) / coef[1]
plt.plot(lx, ly, c = 'blue')
plt.scatter(df_test_negative['Clump Thickness'], df_test_negative['Cell Size'], marker = 'o', s = 200, c = 'red')
plt.scatter(df_test_positive['Clump Thickness'], df_test_positive['Cell Size'], marker = 'x', s= 200, c = 'black')
plt.xlabel('Clump Thickness')
plt.ylabel('Cell Size')
plt.show()运行结果:
Testing accuracy (10 training samples): 0.868571428571
Testing accuracy (all traning samples): 0.937142857143效果图:


所用到的训练数据和测试数据链接链接:http://pan.baidu.com/s/1c30cDS 密码:h8a0

相关文章推荐
- Python机器学习实践与Kaggle实战
- Python机器学习实践与Kaggle实战(转)
- 小白学习Machine Learning in Action-机器学习实战------Python基础
- Python3 机器学习实战自我讲解(一)机器学习基础
- 机器学习(4):python基础及fft、svd、股票k线图、分形等实践
- Python学习笔记之Python基础综合实践-杨辉三角
- 基础入门_Python-模块和包.运维开发中MySQLdb CRUD操作的最佳实践?
- Python中基础的socket编程实战攻略
- 【逆天之作】牛人整理的Python基础知识思维导图的大综合
- Python基础教程实践2,画幅好画(win7,64位系统)
- 从机器学习实战代码3-5,窥探Python函数属性问题
- 2018python数据分析与机器学习实战(视频+源码+课件)
- 1.1机器学习基础-python深度机器学习
- python3 [入门基础实战] 爬虫入门之智联招聘的学习(一)
- 2-Python3从入门到实战—基础之运算符
- Python实践基础
- 【机器学习实践(1)】配置python编程环境
- 实战 - Python基础 之 注释
- python机器学习及实践学习笔记2-编码问题
- 机器学习实战笔记1(机器学习基础)