差异基因分析:fold change(差异倍数), P-value(差异的显著性)
2017-08-16 12:08
2366 查看
在做基因表达分析时必然会要做差异分析(DE)
DE的方法主要有两种:
Fold change
t-test
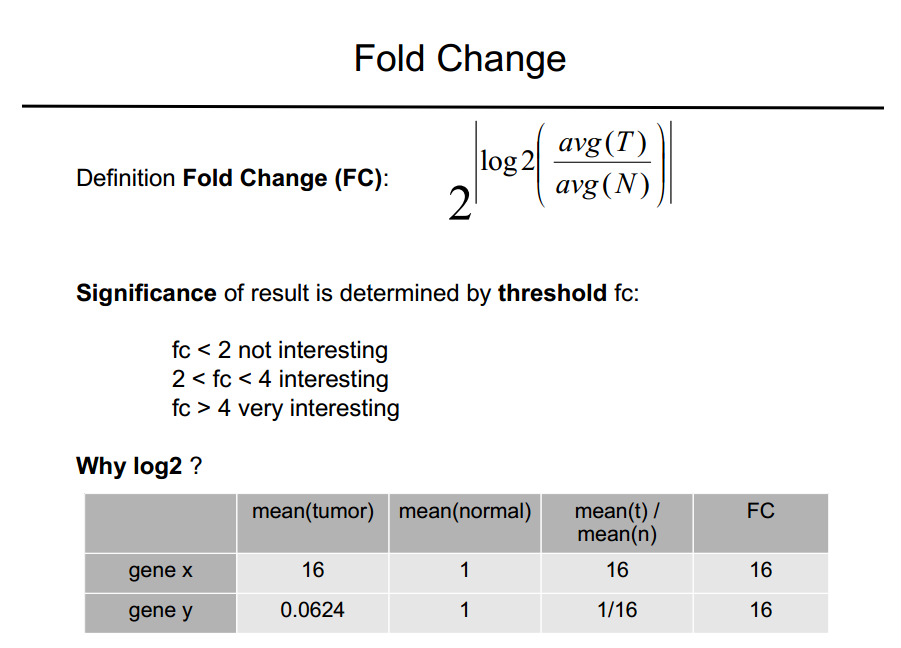
fold change的意思是样本质检表达量的差异倍数,log2 fold change的意思是取log2,这样可以可以让差异特别大的和差异比较小的数值缩小之间的差距。

Q-value,是P-value校正值,P值是统计差异的显著性的。Q值比P值更严格的一种统计。
p-value 就是 t-test 来的:

The mean UMI counts per cell of this gene in cluster i
The log2 fold-change of this gene's expression in cluster i relative to other clusters
The p-value denoting significance of this gene's expression in cluster i relative to other clusters, adjusted to account for the number of hypotheses (i.e. genes) being tested.
10x流程解释
The differential expression analysis seeks to find, for each cluster, genes that are more highly expressed in that cluster relative to the rest of the sample. Here a differential expression test was performed between each cluster and the rest of the sample for each gene.
The Log2 fold-change (L2FC) is an estimate of the log2 ratio of expression in a cluster to that in all other cells. A value of 1.0 indicates 2-fold greater expression in the cluster of interest.
The p-value is a measure of the statistical significance of the expression difference and is based on a negative binomial test. The p-value reported here has been adjusted for multiple testing via the Benjamini-Hochberg procedure.
In this table you can click on a column to sort by that value. Also, in this table genes were filtered by (Mean UMI counts > 1.0) and the top N genes by L2FC for each cluster were retained. Genes with L2FC < 0 or adjusted p-value >= 0.10 were grayed out. The number of top genes shown per cluster, N, is set to limit the number of table entries shown to 10000; N=10000/K^2 where K is the number of clusters. N can range from 1 to 50. For the full table, please refer to the "differential_expression.csv" files produced by the pipeline.
参考:
Question: How to calculate "fold changes" in gene expression?
DE的方法主要有两种:
Fold change
t-test
fold change的意思是样本质检表达量的差异倍数,log2 fold change的意思是取log2,这样可以可以让差异特别大的和差异比较小的数值缩小之间的差距。
Let's say there are 50 read counts in control and 100 read counts in treatment for gene A. This means gene A is expressing twice in treatment as compared to control (100 divided by 50 =2) or fold change is 2. This works well for over expressed genes as the number directly corresponds to how many times a gene is overexpressed. But when it is other way round (i.e, treatment 50, control 100), the value of fold change will be 0.5 (all underexpressed genes will have values between 0 to 1, while overexpressed genes will have values from 1 to infinity). To make this leveled, we use log2 for expressing the fold change. I.e, log2 of 2 is 1 and log2 of 0.5 is -1.
Q-value,是P-value校正值,P值是统计差异的显著性的。Q值比P值更严格的一种统计。
p-value 就是 t-test 来的:

The mean UMI counts per cell of this gene in cluster i
The log2 fold-change of this gene's expression in cluster i relative to other clusters
The p-value denoting significance of this gene's expression in cluster i relative to other clusters, adjusted to account for the number of hypotheses (i.e. genes) being tested.
10x流程解释
The differential expression analysis seeks to find, for each cluster, genes that are more highly expressed in that cluster relative to the rest of the sample. Here a differential expression test was performed between each cluster and the rest of the sample for each gene.
The Log2 fold-change (L2FC) is an estimate of the log2 ratio of expression in a cluster to that in all other cells. A value of 1.0 indicates 2-fold greater expression in the cluster of interest.
The p-value is a measure of the statistical significance of the expression difference and is based on a negative binomial test. The p-value reported here has been adjusted for multiple testing via the Benjamini-Hochberg procedure.
In this table you can click on a column to sort by that value. Also, in this table genes were filtered by (Mean UMI counts > 1.0) and the top N genes by L2FC for each cluster were retained. Genes with L2FC < 0 or adjusted p-value >= 0.10 were grayed out. The number of top genes shown per cluster, N, is set to limit the number of table entries shown to 10000; N=10000/K^2 where K is the number of clusters. N can range from 1 to 50. For the full table, please refer to the "differential_expression.csv" files produced by the pipeline.
参考:
Question: How to calculate "fold changes" in gene expression?
Exact Negative Binomial Test with edgeR

相关文章推荐
- P值(P-value),“差异具有显著性”和“具有显著差异”
- 各浏览器对link标签onload/onreadystatechange事件支持的差异分析
- 一个R程序,表达差异基因:探针分析
- DESeq分析基因的差异表达以及安装中出现的问题
- 各浏览器对link标签onload/onreadystatechange事件支持的差异分析
- 用R和BioConductor进行基因芯片数据分析(六):差异表达基因
- angularJs中ng-init,ng-trim及表单value与$scope数据提交差异分析
- 重新组织数据之四 :Change Reference to Value(将引用对象改为实值对象)
- Android Studio 运行时出现 finished with non-zero exit value 2 错误分析
- jsf中action、actionlistener、valueChangeListener的区别(转)
- IOS开发之——objectForKey与valueForKey在NSDictionary中的差异
- Java IO和Java NIO在文件拷贝上的性能差异分析
- 缓存使用中Redis,Memcached的共性和差异分析
- 数学建模高级方法(九):数据分析之组内一致与组间差异
- 深入分析Java使用+和StringBuilder进行字符串拼接的差异
- 缓存使用中Redis,Memcached的共性和差异分析
- 金税发票与SAP系统发票的税额差异分析
- 工厂模式、工厂方法模式和抽象工厂模式的差异分析
- [Python] 如何证明两组样本有显著性差异(t-test假设检验)
- 用R和BioConductor进行基因芯片数据分析(五):芯片间归一化