R实战:【基本类型】可扩展时间序列类型xts(Extensible Time Series)
2017-08-14 22:15
591 查看
R实战系列专栏
本文翻译自:xts: Extensible Time Series Jeffrey A. Ryan Joshua M. UlrichMay 18, 2008背景介绍
在xts出现之前,R语言有很多种时间序列类型,这对最终的用户来说是不方便的。因为,用户需要写与类型相关的函数。不同的时间序列类型之间还需要转换,而这种转换有时候又会损失数据的完整性。在xts出现之前,quantmod中的chartSeries函数只能接受zoo类型的对象。
xts出现之后,上面的问题得到了解决,没有任何地方需要显示处理xts类型,但是xts类型的对象却在一直被使用。大大降低了终端用户的负担。
xts使得用户可以增加任意属性信息到时间序列对象中。
xts结构
zoo内核内核包括一列用户数据,通常是矩阵存储;一个属性索引,用来排序;
与zoo有三个方面的不同
1 基于时间的索引:为了让xts用起来和普通的时间序列对象一样,xts对象的索引必须是一个已知的时间或者日期对象。比如Date, POSIXct, chron, yearmon, yearqtr,
or timeDate。其中前三种可以满足大多数的应用场景。
2 独有的属性:为了能够支持from转换和to转换,内部属性都是可转换的。
3 用户增加的属性:用户可以任意增加或者删除自定义的属性而不影响对象的显示或者其他用途。这些属性的存储也是和其他对象之间互相转换的基础和依据。
使用xts包
使用xts包最好的例子莫过于将普通时间序列对象转换为xts对象,或者是用xts的构造函数创建xts对象了。用as.xts转换为xts对象
目前可以将任何时间序列类型转换为xts类型,这些类型包括:matrix, data.frame, ts, zoo, irts, timeSeries.
这些对象在转换成xts类型之后再转换回原来的类型不会损失任何信息
下面的例子都是将时间序列对象转换为xts的示例,从代码中可以详细的看出转换的过程和结果
> library("xts")
> require(xts)
> data(sample_matrix)
> class(sample_matrix)
[1] "matrix"
> str(sample_matrix)
num [1:180, 1:4] 50 50.2 50.4 50.4 50.2 ...
- attr(*, "dimnames")=List of 2
..$ : chr [1:180] "2007-01-02" "2007-01-03" "2007-01-04" "2007-01-05" ...
..$ : chr [1:4] "Open" "High" "Low" "Close"
> matrix_xts<-as.xts(sample_matrix,dateFormat = 'Date')
> str(matrix_xts)
An ‘xts’ object on 2007-01-02/2007-06-30 containing:
Data: num [1:180, 1:4] 50 50.2 50.4 50.4 50.2 ...
- attr(*, "dimnames")=List of 2
..$ : NULL
..$ : chr [1:4] "Open" "High" "Low" "Close"
Indexed by objects of class: [Date] TZ: UTC
xts Attributes:
NULL
> df_xts<-as.xts(as.data.frame(sample_matrix),important="very important info!")
> str(df_xts)
An ‘xts’ object on 2007-01-02/2007-06-30 containing:
Data: num [1:180, 1:4] 50 50.2 50.4 50.4 50.2 ...
- attr(*, "dimnames")=List of 2
..$ : NULL
..$ : chr [1:4] "Open" "High" "Low" "Close"
Indexed by objects of class: [POSIXct,POSIXt] TZ:
xts Attributes:
List of 1
$ important: chr "very important info!"如果一个类型没有足够的信息能够说明其实一个时间序列对象,那么转换到xts类型的时候将会使用默认的POSIXct类型作为索引类型(比如matrix和data.frame对象)。上面的第一个例子显示指定了Date作为索引类型,第二个例子没有指定,只是添加了一个字符串属性。
xts的构造函数
> xts_obj<-xts(1:10,Sys.Date()+1:10)
> xts_obj
[,1]
2017-08-16    1
2017-08-17    2
2017-08-18    3
2017-08-19    4
2017-08-20    5
2017-08-21    6
2017-08-22    7
2017-08-23    8
2017-08-24    9
2017-08-25   10
> str(xts_obj)
An ‘xts’ object on 2017-08-16/2017-08-25 containing:
Data: int [1:10, 1] 1 2 3 4 5 6 7 8 9 10
Indexed by objects of class: [Date] TZ: UTC
xts Attributes:
NULL
xts操作函数
xts的长度length(特殊之处)xts的长度需要使用length(index(xts_obj))
> xts_obj<-xts(1:5,Sys.Date()+1:5)
> xts_obj
[,1]
2017-08-23    1
2017-08-24    2
2017-08-25    3
2017-08-26    4
2017-08-27    5
> length(xts_obj)
[1] 5
> names(xts_obj)<-"num"
> xts_obj<-transform(xts_obj,num2 = num+1)
> xts_obj
num num2
2017-08-23   1    2
2017-08-24   2    3
2017-08-25   3    4
2017-08-26   4    5
2017-08-27   5    6
> length(xts_obj)
[1] 10
> length(index(xts_obj))
[1] 5
提取子集
xts类型提供了丰富的方便的按照日期索引提取子集的操作。
提取一个月的数据
matrix_xts['2007-03']提取从开始到截止时间为2007-01-07的全部数据
matrix_xts['/2007-01-17']
筛选时间段
matrix_xts[index(matrix_xts) > as.Date('20070405','%Y%m%d')]非xts类型无法使用xts索引
> sample_matrix[1]
[1] 50.03978
> sample_matrix[1,1]
[1] 50.03978
> # using xts-style subsetting doesn't work on non-xts objects
> sample_matrix['2007-06']
[1] NA
> sample_matrix['2007-06-22']
[1] NA
> sample_matrix[1]
[1] 50.03978
> sample_matrix[1,1]
[1] 50.03978
first 和 last 函数
这两个函数使用aggregate.zoo seq.POSIXt类型的参数来作为提取条件
第一周的数据
first(matrix_xts,'1 week')最后一周的前3天数据
first(last(matrix_xts,'1 week'),'3 days')
索引
索引类型> indexClass(matrix_xts) [1] "Date" > indexClass(convertIndex(matrix_xts,'POSIXct')) [1] "POSIXct" "POSIXt"
按下标索引
> buyIndex
[1] 30
> s[buyIndex]
Open  High   Low Close  Volume Adjusted
2015-01-13 14.03 14.93 13.82 14.47 4899856 86904992
提取下标索引endpoints
endpoints(x, on="months", k=1)
> data(sample_matrix)
>
> endpoints(sample_matrix)
[1]   0  30  58  89 119 150 180
> endpoints(sample_matrix, 'weeks')
[1]   0   7  14  21  28  35  42  49  56  63  70  77  84  91  98 105 112 119 126 133 140
[22] 147 154 161 168 175 180
索引值
> dt<-xts(1:10,Sys.Date()+1:10)
> dt
[,1]
2017-08-21    1
2017-08-22    2
2017-08-23    3
2017-08-24    4
2017-08-25    5
2017-08-26    6
2017-08-27    7
2017-08-28    8
2017-08-29    9
2017-08-30   10
> index(dt)
[1] "2017-08-21" "2017-08-22" "2017-08-23" "2017-08-24" "2017-08-25" "2017-08-26"
[7] "2017-08-27" "2017-08-28" "2017-08-29" "2017-08-30"
扩展属性
使用attr函数读写属性> str(attributes(df_xts)) List of 9 $ dim : int [1:2] 180 4 $ dimnames :List of 2 ..$ : NULL ..$ : chr [1:4] "Open" "High" "Low" "Close" $ index : atomic [1:180] 1.17e+09 1.17e+09 1.17e+09 1.17e+09 1.17e+09 ... ..- attr(*, "tzone")= chr "" ..- attr(*, "tclass")= chr [1:2] "POSIXct" "POSIXt" $ .indexCLASS: chr [1:2] "POSIXct" "POSIXt" $ tclass : chr [1:2] "POSIXct" "POSIXt" $ .indexTZ : chr "" $ tzone : chr "" $ important : chr "very important info!" $ class : chr [1:2] "xts" "zoo" > attr(df_xts,'important') [1] "very important info!" > attr(df_xts,'important')<-"very important info!+1" > attr(df_xts,'important') [1] "very important info!+1"
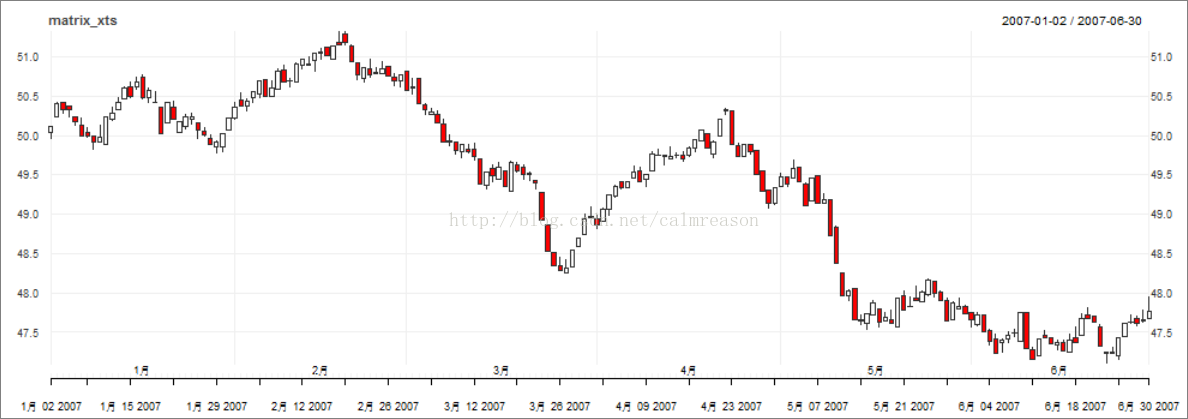
绘制图像
plot(matrix_xts[,1],major.ticks='months',minor.ticks=FALSE,main=NULL,col=3) #main=NULL 表示不设置图标的标题 col=3表示颜色为3号颜色

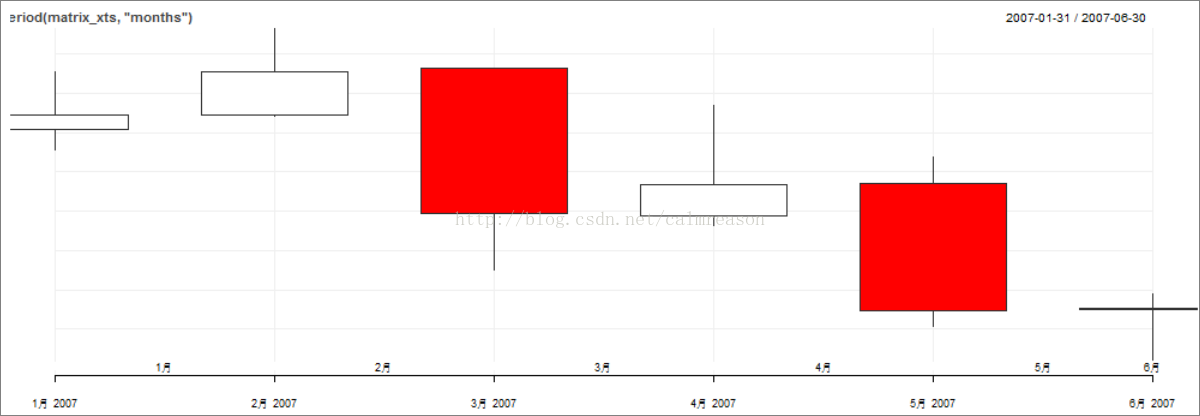
辅助函数to.period(日K线、周K线、月K线)
> library(quantmod)
> chart_Series(matrix_xts)
> chart_Series(to.period(matrix_xts,'weeks'))
> chart_Series(to.period(matrix_xts,'months'))


相关文章推荐
- 预测和分解时间序列数据(小时)Forecast and STL hourly time series data
- 【翻译】从头开始写一个时间序列数据库-Writing a Time Series Database from Scratch
- 可扩展的时间序列xts
- 可扩展的时间序列xts
- Time Series Prediction:时间序列预测
- How to Save an ARIMA Time Series Forecasting Model in Python (如何在Python中保存ARIMA时间序列预测模型)
- MATLAB时间序列预测Prediction of time series with NAR neural network
- xts可扩展的时间序列
- 在电力智能测量数据应用中的分层时间序列预测正则化(Regularization in Hierarchical Time Series Forecasting with Application to)
- 时间序列 R 07 时间序列分解 Time series decomposition
- 时间序列分段算法 [Time series Breakout Detection]
- 单独获取ShopEx商品类型中的扩展参数,如配货时间
- MySQL数据类型--------日期与时间类型实战
- 每日学习心得:Js基本数据类型常用方法扩展
- Js基本数据类型常用方法扩展(基本数据处理)
- Asp.net AJAX JavaScript 基本类型扩展(5)——Number 类型及其扩展
- 【AspNetCore】【WebApi】扩展Webapi中的RouteConstraint中,让DateTime类型,支持时间格式化(DateTimeFormat)
- FreeMarker的四种基本数据类型及其序列和哈希表
- (转)---C语言中两种方式表示时间日期值time_t和struct tm类型的相互转换
- Python成长之路(一)——准备、基本数据类型、序列、运算、缩进和选择