使用Python统计微信好友的男女比例
2017-08-08 16:22
791 查看
偶然间发现了Python的itchat库,在网上搜索相关关键词发现它可以干很多好玩的事情,说干就干!
一.安装相应的库
我用的是Windows环境下的Python3.5,IDE用的是pycharm.
pip install itchat
pip install echarts // echarts 是Python中用来把数据转换为可视化图表的一个库
二.实现模拟登陆
itchat这个库提供的登录其实就是模拟登陆网页版的微信,也就是说,网页版微信能做到的,这个库都能做到,网页版微信做不到的事情,这个库也是做不到的.
运行过上面这段代码后,屏幕上会弹出一个二维码图案

然后用你的手机微信扫一扫 确认登录就可以了
三.微信好友获取及数据处理
获取你的所有微信好友
在pycharm中进行抓包,发现通过
得到的列表中:第0个是你自己的微信资料.然后运行代码:Getting uuid of QR code.
Downloading QR code.
Please scan the QR code to log in.
Please press confirm on your phone.
Loading the contact, this may take a little while.
Login successfully as 微信昵称
男性好友:62.50%
女性好友:32.77%
其他:5.07%
四.使用饼图展示个人好友性别分布
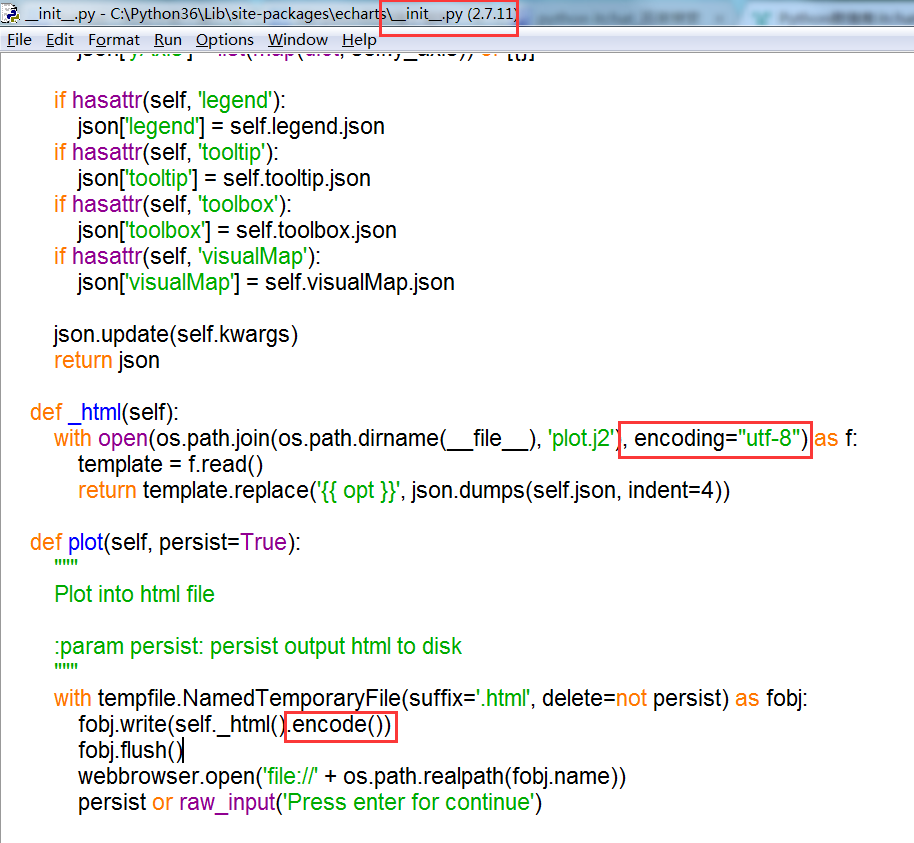
echarts库可以帮助你方便的使用python代码在浏览器中展示Echart图。但是,但是,这个库是Python2的,Python3用起来水土不服,没办法只好根据错误修改库的源码!下图显示了应该改的两个地方(其实还有很多地方)。
改完库的源码,就可以执行代码了。
完整代码:
import itchat
import echarts
from echarts import Echart,Legend,Pie
itchat.auto_login(hotReload=True)
itchat.dump_login_status()
friends = itchat.get_friends(update=True)[:] total = len(friends) - 1 man = women = other = 0 for friend in friends[0:] : sex = friend["Sex"] if sex == 1 : man += 1 elif sex == 2 : women += 1 else : other += 1 print("男性好友:%.2f%%" % (float(man) / total * 100)) print("女性好友:%.2f%%" % (float(women) / total * 100)) print("其他:%.2f%%" % (float(other) / total * 100))
# itchat.send(u'程序消息发送测试','filehelper')
chart = Echart('%s的微信好友性别比例' % (friends[0]['NickName']),'from Wechat')
chart.use(Pie('WeChat',
[{'value': man, 'name': '男性 %.2f%%' % (float(man) / total * 100)},
{'value': women, 'name': '女性 %.2f%%' % (float(women) / total * 100)},
{'value': other, 'name': '其他 %.2f%%' % (float(other) / total * 100)}],
radius=["50%", "70%"]))
chart.use(Legend(['man','women','other']))
del chart.json["xAxis"]
del chart.json["yAxis"]
chart.plot()
运行效果:
我好像暴露了什么.....
参考文章:http://www.cnblogs.com/feixuelove1009/p/6950102.html
一.安装相应的库
我用的是Windows环境下的Python3.5,IDE用的是pycharm.
pip install itchat
pip install echarts // echarts 是Python中用来把数据转换为可视化图表的一个库
二.实现模拟登陆
itchat这个库提供的登录其实就是模拟登陆网页版的微信,也就是说,网页版微信能做到的,这个库都能做到,网页版微信做不到的事情,这个库也是做不到的.
itchat.auto_login(hotReload=True)  //实现登录状态保留 使你不用每运行一次就要扫一次二维码,默认是FALSE
itchat.dump_login_status()
运行过上面这段代码后,屏幕上会弹出一个二维码图案
然后用你的手机微信扫一扫 确认登录就可以了
三.微信好友获取及数据处理
获取你的所有微信好友
friends = itchat.get_friends(update=True)[:]
total = len(friends) - 1
man = women = other = 0

for friend in friends[0:] :
sex = friend["Sex"]
if sex == 1 :
man += 1
elif sex == 2 :
women += 1
else :
other += 1

print("男性好友:%.2f%%" % (float(man) / total * 100))
print("女性好友:%.2f%%" % (float(women) / total * 100))
print("其他:%.2f%%" % (float(other) / total * 100))
在pycharm中进行抓包,发现通过
itchat.get_friends(update=True)[:]
得到的列表中:第0个是你自己的微信资料.然后运行代码:Getting uuid of QR code.
Downloading QR code.
Please scan the QR code to log in.
Please press confirm on your phone.
Loading the contact, this may take a little while.
Login successfully as 微信昵称
男性好友:62.50%
女性好友:32.77%
其他:5.07%
四.使用饼图展示个人好友性别分布
echarts库可以帮助你方便的使用python代码在浏览器中展示Echart图。但是,但是,这个库是Python2的,Python3用起来水土不服,没办法只好根据错误修改库的源码!下图显示了应该改的两个地方(其实还有很多地方)。
改完库的源码,就可以执行代码了。
完整代码:
import itchat
import echarts
from echarts import Echart,Legend,Pie
itchat.auto_login(hotReload=True)
itchat.dump_login_status()
friends = itchat.get_friends(update=True)[:] total = len(friends) - 1 man = women = other = 0 for friend in friends[0:] : sex = friend["Sex"] if sex == 1 : man += 1 elif sex == 2 : women += 1 else : other += 1 print("男性好友:%.2f%%" % (float(man) / total * 100)) print("女性好友:%.2f%%" % (float(women) / total * 100)) print("其他:%.2f%%" % (float(other) / total * 100))
# itchat.send(u'程序消息发送测试','filehelper')
chart = Echart('%s的微信好友性别比例' % (friends[0]['NickName']),'from Wechat')
chart.use(Pie('WeChat',
[{'value': man, 'name': '男性 %.2f%%' % (float(man) / total * 100)},
{'value': women, 'name': '女性 %.2f%%' % (float(women) / total * 100)},
{'value': other, 'name': '其他 %.2f%%' % (float(other) / total * 100)}],
radius=["50%", "70%"]))
chart.use(Legend(['man','women','other']))
del chart.json["xAxis"]
del chart.json["yAxis"]
chart.plot()
运行效果:
我好像暴露了什么.....
参考文章:http://www.cnblogs.com/feixuelove1009/p/6950102.html

相关文章推荐
- 100%教会你python爬取微信好友男女性别比例和地区分布
- 利用Python统计微信联系人男女比例以及简单的地区分布
- Python实践-itchat获取微信好友总人数以及男女比例
- 使用Python统计csdn技术专家男女比例
- python实现爬虫统计学校BBS男女比例(一)前期准备、方案分析
- 用python玩微信(聊天机器人,好友信息统计)
- 使用Python微信库itchat获得好友和群组已撤回的消息
- Python对微信好友进行简单统计分析
- python实现爬虫统计学校BBS男女比例之数据处理(三)
- python实现爬虫统计学校BBS男女比例(一)前期准备、方案分析
- python实现爬虫统计学校BBS男女比例(二)多线程爬虫
- python实现爬虫统计学校BBS男女比例之多线程爬虫(二)
- python实现爬虫统计学校BBS男女比例(三)数据处理
- 使用Python对微信好友进行数据分析
- python数据分析(1)——获取微信好友的统计信息
- python实现爬虫统计学校BBS男女比例(三)数据处理
- python实现爬虫统计学校BBS男女比例之多线程爬虫(二)
- 使用python3获取微信好友并导入到excle中
- python实现爬虫统计学校BBS男女比例(二)多线程爬虫
- python实现爬虫统计学校BBS男女比例(一)