zabbix监控磁盘IO
2017-07-29 13:12
525 查看
监控磁盘IO的基本原理:通过分析/proc/diskstats文件,来对IO的性能进行监控。
# cat /proc/diskstats |grep sda |head -1
8 0 sda 2280 1445 76478 11956 249 188 3490 932 0 9913 12805
解释说明:
第一至第三个域,分别是主设备号,次设备号,设备名称
第4个域:读完成次数 —– 读磁盘的次数,成功完成读的总次数。
(number of issued reads. This is the total number of reads completed successfully.)
第5个域:合并读完成次数, 第9个域:合并写完成次数。为了效率可能会合并相邻的读和写。从而两次4K的读在它最终被处理到磁盘上之前可能会变成一次8K的读,才被计数(和排队),因此只有一次I/O操作。这个域使你知道这样的操作有多频繁。
(number of reads merged)
第6个域:读扇区的次数,成功读过的扇区总次数。
(number of sectors read. This is the total number of sectors read successfully.)
第7个域:读花费的毫秒数,这是所有读操作所花费的毫秒数(用__make_request()到end_that_request_last()测量)。
(number of milliseconds spent reading. This is the total number of
milliseconds spent by all reads (as measured from __make_request() to
end_that_request_last()).)
第8个域:写完成次数 —-写完成的次数,成功写完成的总次数。
(number of writes completed. This is the total number of writes completed successfully.)
第9个域:合并写完成次数 —–合并写次数。
(number of writes merged Reads and writes which are adjacent to each
other may be merged for efficiency. Thus two 4K reads may become one 8K
read before it is ultimately handed to the disk, and so it will be
counted (and queued) as only one I/O. This field lets you know how often
this was done.)
第10个域:写扇区次数 —- 写扇区的次数,成功写扇区总次数。
(number of sectors written. This is the total number of sectors written successfully.)
第11个域:写操作花费的毫秒数 — 写花费的毫秒数,这是所有写操作所花费的毫秒数(用__make_request()到end_that_request_last()测量)。
(number of milliseconds spent writing This is the total number of
milliseconds spent by all writes (as measured from __make_request() to
end_that_request_last()).)
第12个域:正在处理的输入/输出请求数 — -I/O的当前进度,只有这个域应该是0。当请求被交给适当的request_queue_t时增加和请求完成时减小。
(number of I/Os currently in progress. The only field that should go
to zero. Incremented as requests are given to appropriate
request_queue_t and decremented as they finish.)
第13个域:输入/输出操作花费的毫秒数 —-花在I/O操作上的毫秒数,这个域会增长只要field 9不为0。
(number of milliseconds spent doing I/Os. This field is increased so long as field 9 is nonzero.)
第14个域:输入/输出操作花费的加权毫秒数 —– 加权, 花在I/O操作上的毫秒数,在每次I/O开始,I/O结束,I/O合并时这个域都会增加。这可以给I/O完成时间和存储那些可以累积的提供一个便利的测量标准。
(number of milliseconds spent doing I/Os. This field is incremented
at each I/O start, I/O completion, I/O merge, or read of these stats by
the number of I/Os in progress (field 9) times the number of
milliseconds spent doing I/O since the last update of this field. This
can provide an easy measure of both I/O completion time and the backlog
that may be accumulating.)
修改客户端配置文件
root@ubuntu:/usr/local/zabbix/etc# vim zabbix_agentd.conf
UserParameter=custom.vfs.dev.read.ops[*],cat /proc/diskstats | grep $1 | head -1 | awk ‘{print $$4}’
UserParameter=custom.vfs.dev.read.ms[*],cat /proc/diskstats | grep $1 | head -1 | awk ‘{print $$7}’
UserParameter=custom.vfs.dev.write.ops[*],cat /proc/diskstats | grep $1 | head -1 | awk ‘{print $$8}’
UserParameter=custom.vfs.dev.write.ms[*],cat /proc/diskstats | grep $1 | head -1 | awk ‘{print $$11}’
UserParameter=custom.vfs.dev.io.active[*],cat /proc/diskstats | grep $1 | head -1 | awk ‘{print $$12}’
UserParameter=custom.vfs.dev.io.ms[*],cat /proc/diskstats | grep $1 | head -1 | awk ‘{print $$13}’
UserParameter=custom.vfs.dev.read.sectors[*],cat /proc/diskstats | grep $1 | head -1 | awk ‘{print $$6}’
UserParameter=custom.vfs.dev.write.sectors[*],cat /proc/diskstats | grep $1 | head -1 | awk ‘{print $$10}’
在服务器端测试,是否能取到数据:
[root@zabbix bin]# ./zabbix_get -s 192.168.100.242 -p 10050 -k ‘custom.vfs.dev.read.ops[sdg]’
1916160
[root@zabbix bin]# ./zabbix_get -s 192.168.100.242 -p 10050 -k ‘custom.vfs.dev.read.ops[sdg]’
1916160
[root@zabbix bin]# ./zabbix_get -s 192.168.100.242 -p 10050 -k ‘custom.vfs.dev.read.ops[sdg]’
1916160
[root@zabbix bin]# ./zabbix_get -s 192.168.100.242 -p 10050 -k ‘custom.vfs.dev.read.ops[sdg]’
1916160
[root@zabbix bin]# ./zabbix_get -s 192.168.100.242 -p 10050 -k ‘custom.vfs.dev.read.ops[sdg]’
1916160
[root@zabbix bin]# ./zabbix_get -s 192.168.100.242 -p 10050 -k ‘custom.vfs.dev.read.ops[sdg]’
1916160
[root@zabbix bin]# ./zabbix_get -s 192.168.100.242 -p 10050 -k ‘custom.vfs.dev.read.ops[sdg]’
1916160
[root@zabbix bin]# ./zabbix_get -s 192.168.100.242 -p 10050 -k ‘custom.vfs.dev.read.ops[sdg]’
1916160
[root@zabbix bin]# ./zabbix_get -s 192.168.100.242 -p 10050 -k ‘custom.vfs.dev.read.ops[sdg1]’
1915991
zabbix web浏览器操作:
1、添加指标:思路:首先添加模板 ,然后在模板上添加item。
configuration——templates——右上角点create templates ,填写模板名称,并加入到一个组;

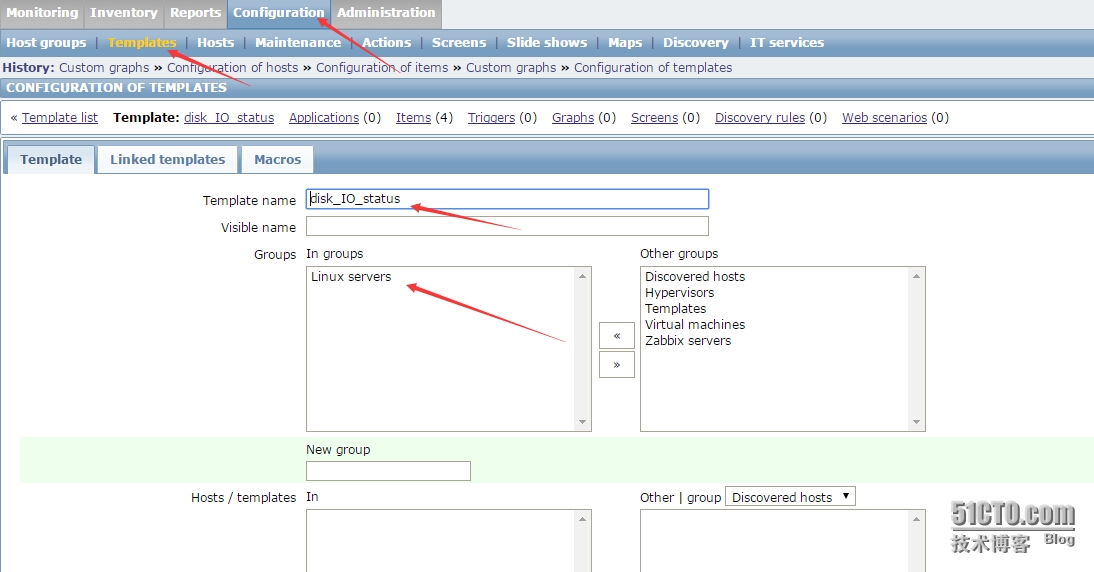
2、进入新创建的模板——items,右上角create items
指标细节:
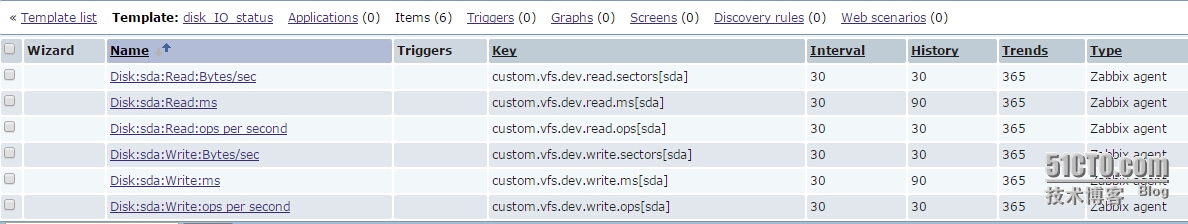
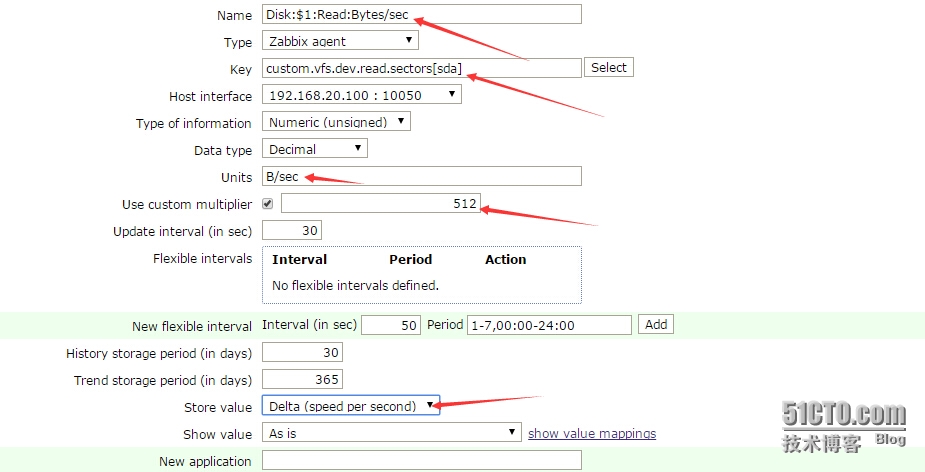
第一个指标Name: Disk:$1:Read:Bytes/sec
Key: custom.vfs.dev.read.sectors[sda]
Units: B/sec
Store value: speed per second //差量每秒速率,会进行差值计算
Use custom multiplier 512 //会对值乘以512,因为这里是一个扇区,转换为字节为512B
同理,其他指标方式,添加如下:
第二个指标:Name: Disk:$1:Write:Bytes/sec
Key: custom.vfs.dev.write.sectors[sda]
Units: B/sec
Store value: speed per second
Use custom multiplier 512
第三个指标:Name: Disk:$1:Read:ops per second
Key: custom.vfs.dev.read.ops[sda]
Units: ops/second
Store value: speed per second
第四个指标:Name: Disk:$1:Write:ops per second
Key: custom.vfs.dev.write.ops[sda]
Units: ops/second
Store value: speed per second
第五个指标:Name: Disk:$1:Read:ms
Key: custom.vfs.dev.read.ms[sda]
Units: ms
Store value: speed per second
第六个指标:Name: Disk:$1:Write:ms
Key: custom.vfs.dev.write.ms[sda]
Units: ms
Store value: speed per second
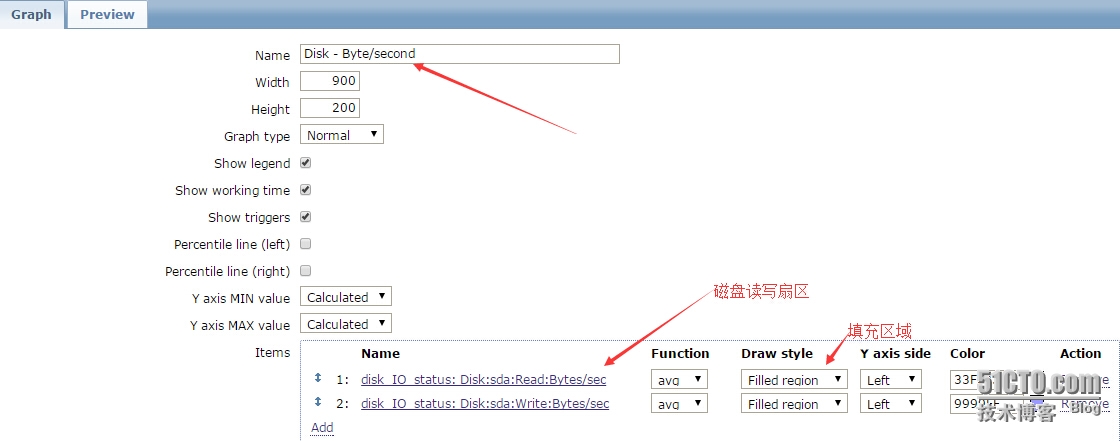
3、进入新创建的模板——graphs,右上角点create graphs,填写name,添加item项目,选择图形类型
4、拷贝创建好的items、graphs复制到需要监控的主机里
5、Monitoring——graps,选择Group,host,graph项目,监控出图;

zabbix监控磁盘IO到此为止,针对有多块硬盘的机器可以编写脚本,自动提取硬盘名称进行监控;
# cat /proc/diskstats |grep sda |head -1
8 0 sda 2280 1445 76478 11956 249 188 3490 932 0 9913 12805
解释说明:
第一至第三个域,分别是主设备号,次设备号,设备名称
第4个域:读完成次数 —– 读磁盘的次数,成功完成读的总次数。
(number of issued reads. This is the total number of reads completed successfully.)
第5个域:合并读完成次数, 第9个域:合并写完成次数。为了效率可能会合并相邻的读和写。从而两次4K的读在它最终被处理到磁盘上之前可能会变成一次8K的读,才被计数(和排队),因此只有一次I/O操作。这个域使你知道这样的操作有多频繁。
(number of reads merged)
第6个域:读扇区的次数,成功读过的扇区总次数。
(number of sectors read. This is the total number of sectors read successfully.)
第7个域:读花费的毫秒数,这是所有读操作所花费的毫秒数(用__make_request()到end_that_request_last()测量)。
(number of milliseconds spent reading. This is the total number of
milliseconds spent by all reads (as measured from __make_request() to
end_that_request_last()).)
第8个域:写完成次数 —-写完成的次数,成功写完成的总次数。
(number of writes completed. This is the total number of writes completed successfully.)
第9个域:合并写完成次数 —–合并写次数。
(number of writes merged Reads and writes which are adjacent to each
other may be merged for efficiency. Thus two 4K reads may become one 8K
read before it is ultimately handed to the disk, and so it will be
counted (and queued) as only one I/O. This field lets you know how often
this was done.)
第10个域:写扇区次数 —- 写扇区的次数,成功写扇区总次数。
(number of sectors written. This is the total number of sectors written successfully.)
第11个域:写操作花费的毫秒数 — 写花费的毫秒数,这是所有写操作所花费的毫秒数(用__make_request()到end_that_request_last()测量)。
(number of milliseconds spent writing This is the total number of
milliseconds spent by all writes (as measured from __make_request() to
end_that_request_last()).)
第12个域:正在处理的输入/输出请求数 — -I/O的当前进度,只有这个域应该是0。当请求被交给适当的request_queue_t时增加和请求完成时减小。
(number of I/Os currently in progress. The only field that should go
to zero. Incremented as requests are given to appropriate
request_queue_t and decremented as they finish.)
第13个域:输入/输出操作花费的毫秒数 —-花在I/O操作上的毫秒数,这个域会增长只要field 9不为0。
(number of milliseconds spent doing I/Os. This field is increased so long as field 9 is nonzero.)
第14个域:输入/输出操作花费的加权毫秒数 —– 加权, 花在I/O操作上的毫秒数,在每次I/O开始,I/O结束,I/O合并时这个域都会增加。这可以给I/O完成时间和存储那些可以累积的提供一个便利的测量标准。
(number of milliseconds spent doing I/Os. This field is incremented
at each I/O start, I/O completion, I/O merge, or read of these stats by
the number of I/Os in progress (field 9) times the number of
milliseconds spent doing I/O since the last update of this field. This
can provide an easy measure of both I/O completion time and the backlog
that may be accumulating.)
修改客户端配置文件
root@ubuntu:/usr/local/zabbix/etc# vim zabbix_agentd.conf
UserParameter=custom.vfs.dev.read.ops[*],cat /proc/diskstats | grep $1 | head -1 | awk ‘{print $$4}’
UserParameter=custom.vfs.dev.read.ms[*],cat /proc/diskstats | grep $1 | head -1 | awk ‘{print $$7}’
UserParameter=custom.vfs.dev.write.ops[*],cat /proc/diskstats | grep $1 | head -1 | awk ‘{print $$8}’
UserParameter=custom.vfs.dev.write.ms[*],cat /proc/diskstats | grep $1 | head -1 | awk ‘{print $$11}’
UserParameter=custom.vfs.dev.io.active[*],cat /proc/diskstats | grep $1 | head -1 | awk ‘{print $$12}’
UserParameter=custom.vfs.dev.io.ms[*],cat /proc/diskstats | grep $1 | head -1 | awk ‘{print $$13}’
UserParameter=custom.vfs.dev.read.sectors[*],cat /proc/diskstats | grep $1 | head -1 | awk ‘{print $$6}’
UserParameter=custom.vfs.dev.write.sectors[*],cat /proc/diskstats | grep $1 | head -1 | awk ‘{print $$10}’
在服务器端测试,是否能取到数据:
[root@zabbix bin]# ./zabbix_get -s 192.168.100.242 -p 10050 -k ‘custom.vfs.dev.read.ops[sdg]’
1916160
[root@zabbix bin]# ./zabbix_get -s 192.168.100.242 -p 10050 -k ‘custom.vfs.dev.read.ops[sdg]’
1916160
[root@zabbix bin]# ./zabbix_get -s 192.168.100.242 -p 10050 -k ‘custom.vfs.dev.read.ops[sdg]’
1916160
[root@zabbix bin]# ./zabbix_get -s 192.168.100.242 -p 10050 -k ‘custom.vfs.dev.read.ops[sdg]’
1916160
[root@zabbix bin]# ./zabbix_get -s 192.168.100.242 -p 10050 -k ‘custom.vfs.dev.read.ops[sdg]’
1916160
[root@zabbix bin]# ./zabbix_get -s 192.168.100.242 -p 10050 -k ‘custom.vfs.dev.read.ops[sdg]’
1916160
[root@zabbix bin]# ./zabbix_get -s 192.168.100.242 -p 10050 -k ‘custom.vfs.dev.read.ops[sdg]’
1916160
[root@zabbix bin]# ./zabbix_get -s 192.168.100.242 -p 10050 -k ‘custom.vfs.dev.read.ops[sdg]’
1916160
[root@zabbix bin]# ./zabbix_get -s 192.168.100.242 -p 10050 -k ‘custom.vfs.dev.read.ops[sdg1]’
1915991
zabbix web浏览器操作:
1、添加指标:思路:首先添加模板 ,然后在模板上添加item。
configuration——templates——右上角点create templates ,填写模板名称,并加入到一个组;
2、进入新创建的模板——items,右上角create items
指标细节:
第一个指标Name: Disk:$1:Read:Bytes/sec
Key: custom.vfs.dev.read.sectors[sda]
Units: B/sec
Store value: speed per second //差量每秒速率,会进行差值计算
Use custom multiplier 512 //会对值乘以512,因为这里是一个扇区,转换为字节为512B
同理,其他指标方式,添加如下:
第二个指标:Name: Disk:$1:Write:Bytes/sec
Key: custom.vfs.dev.write.sectors[sda]
Units: B/sec
Store value: speed per second
Use custom multiplier 512
第三个指标:Name: Disk:$1:Read:ops per second
Key: custom.vfs.dev.read.ops[sda]
Units: ops/second
Store value: speed per second
第四个指标:Name: Disk:$1:Write:ops per second
Key: custom.vfs.dev.write.ops[sda]
Units: ops/second
Store value: speed per second
第五个指标:Name: Disk:$1:Read:ms
Key: custom.vfs.dev.read.ms[sda]
Units: ms
Store value: speed per second
第六个指标:Name: Disk:$1:Write:ms
Key: custom.vfs.dev.write.ms[sda]
Units: ms
Store value: speed per second
3、进入新创建的模板——graphs,右上角点create graphs,填写name,添加item项目,选择图形类型
4、拷贝创建好的items、graphs复制到需要监控的主机里
5、Monitoring——graps,选择Group,host,graph项目,监控出图;
zabbix监控磁盘IO到此为止,针对有多块硬盘的机器可以编写脚本,自动提取硬盘名称进行监控;

相关文章推荐
- [置顶] 【zabbix教程四】——zabbix3.0监控磁盘IO与自定义模板
- zabbix监控磁盘IO
- 分布式监控系统Zabbix-3.0.3-完整安装记录(3)-监控nginx,php,memcache,Low-level discovery磁盘IO
- zabbix 监控磁盘IO
- zabbix添加对linux主机磁盘io监控
- 如何用zabbix来监控磁盘IO?
- zabbix监控磁盘IO low-level-discory方式-iostat说明
- zabbix应用之Low-level discovery监控磁盘IO
- zabbix3.0.4利用iostat工具监控centos主机磁盘IO
- zabbix应用之Low-level discovery监控磁盘IO
- Zabbix监控之监控磁盘IO
- 分布式监控系统Zabbix3.2添加自动发现磁盘IO并注册监控
- zabbix 新增磁盘IO监控的完整操作过程
- zabbix磁盘IO监控
- zabbix 监控磁盘IO状态
- Zabbix 监控磁盘IO状态
- zabbix自动发现规则之磁盘IO监控
- Zabbix 监控磁盘IO状态