【Tensorflow】TensorBoard可视化网络结构和参数Tensorboard windows显示空白
2017-06-03 08:49
836 查看
安装可视化工具tensorboard时候,发现pip找不到文件。上网咨询,说tensorflow版本有关,之前是1.1.0版本,降级安装为1.0.0版本。安装方式为:
pip install tensorflow==1.0.0
----------------------------------------------------------------------------------------------------------
文章转载自:http://blog.csdn.net/helei001/article/details/51842531(何雷的博客)
在学习深度网络框架的过程中,我们发现一个问题,就是如何输出各层网络参数,用于更好地理解,调试和优化网络?针对这个问题,TensorFlow开发了一个特别有用的可视化工具包:TensorBoard,既可以显示网络结构,又可以显示训练和测试过程中各层参数的变化情况。本博文分为四个部分,第一部分介绍相关函数,第二部分是代码测试,第三部分是运行结果,第四部分介绍相关参考资料。
一. 相关函数
TensorBoard的输入是tensorflow保存summary data的日志文件。日志文件名的形式如:events.out.tfevents.1467809796.lei-All-Series 或 events.out.tfevents.1467809800.lei-All-Series。TensorBoard可读的summary
data有scalar,images,audio,histogram和graph。那么怎么把这些summary data保存在日志文件中呢?
数值如学习率,损失函数用scalar_summary函数。tf.scalar_summary(节点名称,获取的数据)
[python] view
plain copy
accuracy = tf.reduce_mean(tf.cast(correct_prediction, tf.float32))
tf.scalar_summary('accuracy', accuracy)
各层网络权重,偏置的分布,用histogram_summary函数
[python] view
plain copy
preactivate = tf.matmul(input_tensor, weights) + biases
tf.histogram_summary(layer_name + '/pre_activations', preactivate)
其他几种summary data也是同样的方式获取,只是对应的获取函数名称换一下。这些获取summary data函数节点和graph是独立的,调用的时候也需要运行session。当需要获取的数据较多的时候,我们一个一个去保存获取到的数据,以及一个一个去运行会显得比较麻烦。tensorflow提供了一个简单的方法,就是合并所有的summary
data的获取函数,保存和运行只对一个对象进行操作。比如,写入默认路径中,比如/tmp/mnist_logs (by default)
[python] view
plain copy
merged = tf.merge_all_summaries()
train_writer = tf.train.SummaryWriter(FLAGS.summaries_dir + '/train', sess.graph)
test_writer = tf.train.SummaryWriter(FLAGS.summaries_dir + '/test')
SummaryWriter从tensorflow获取summary data,然后保存到指定路径的日志文件中。以上是在建立graph的过程中,接下来执行,每隔一定step,写入网络参数到默认路径中,形成最开始的文件:events.out.tfevents.1467809796.lei-All-Series 或 events.out.tfevents.1467809800.lei-All-Series。
[python] view
plain copy
for i in range(FLAGS.max_steps):
if i % 10 == 0: # Record summaries and test-set accuracy
summary, acc = sess.run([merged, accuracy], feed_dict=feed_dict(False))
test_writer.add_summary(summary, i)
print('Accuracy at step %s: %s' % (i, acc))
else: # Record train set summarieis, and train
summary, _ = sess.run([merged, train_step], feed_dict=feed_dict(True))
train_writer.add_summary(summary, i)
二. 代码测试
[python] view
plain copy
# Copyright 2015 Google Inc. All Rights Reserved.
#
# Licensed under the Apache License, Version 2.0 (the 'License');
# you may not use this file except in compliance with the License.
# You may obtain a copy of the License at
#
# http://www.apache.org/licenses/LICENSE-2.0
#
# Unless required by applicable law or agreed to in writing, software
# distributed under the License is distributed on an 'AS IS' BASIS,
# WITHOUT WARRANTIES OR CONDITIONS OF ANY KIND, either express or implied.
# See the License for the specific language governing permissions and
# limitations under the License.
# ==============================================================================
"""A simple MNIST classifier which displays summaries in TensorBoard.
This is an unimpressive MNIST model, but it is a good example of using
tf.name_scope to make a graph legible in the TensorBoard graph explorer, and of
naming summary tags so that they are grouped meaningfully in TensorBoard.
It demonstrates the functionality of every TensorBoard dashboard.
"""
from __future__ import absolute_import
from __future__ import division
from __future__ import print_function
import tensorflow as tf
from tensorflow.examples.tutorials.mnist import input_data
flags = tf.app.flags
FLAGS = flags.FLAGS
flags.DEFINE_boolean('fake_data', False, 'If true, uses fake data '
'for unit testing.')
flags.DEFINE_integer('max_steps', 1000, 'Number of steps to run trainer.')
flags.DEFINE_float('learning_rate', 0.001, 'Initial learning rate.')
flags.DEFINE_float('dropout', 0.9, 'Keep probability for training dropout.')
flags.DEFINE_string('data_dir', '/tmp/data', 'Directory for storing data')
flags.DEFINE_string('summaries_dir', '/tmp/mnist_logs', 'Summaries directory')
def train():
# Import data
mnist = input_data.read_data_sets(FLAGS.data_dir, one_hot=True,
fake_data=FLAGS.fake_data)
sess = tf.InteractiveSession()
# Create a multilayer model.
# Input placehoolders
with tf.name_scope('input'):
x = tf.placeholder(tf.float32, [None, 784], name='x-input')
image_shaped_input = tf.reshape(x, [-1, 28, 28, 1])
tf.image_summary('input', image_shaped_input, 10)
y_ = tf.placeholder(tf.float32, [None, 10], name='y-input')
keep_prob = tf.placeholder(tf.float32)
tf.scalar_summary('dropout_keep_probability', keep_prob)
# We can't initialize these variables to 0 - the network will get stuck.
def weight_variable(shape):
"""Create a weight variable with appropriate initialization."""
initial = tf.truncated_normal(shape, stddev=0.1)
return tf.Variable(initial)
def bias_variable(shape):
"""Create a bias variable with appropriate initialization."""
initial = tf.constant(0.1, shape=shape)
return tf.Variable(initial)
def variable_summaries(var, name):
"""Attach a lot of summaries to a Tensor."""
with tf.name_scope('summaries'):
mean = tf.reduce_mean(var)
tf.scalar_summary('mean/' + name, mean)
with tf.name_scope('stddev'):
stddev = tf.sqrt(tf.reduce_sum(tf.square(var - mean)))
tf.scalar_summary('sttdev/' + name, stddev)
tf.scalar_summary('max/' + name, tf.reduce_max(var))
tf.scalar_summary('min/' + name, tf.reduce_min(var))
tf.histogram_summary(name, var)
def nn_layer(input_tensor, input_dim, output_dim, layer_name, act=tf.nn.relu):
"""Reusable code for making a simple neural net layer.
It does a matrix multiply, bias add, and then uses relu to nonlinearize.
It also sets up name scoping so that the resultant graph is easy to read, and
adds a number of summary ops.
"""
# Adding a name scope ensures logical grouping of the layers in the graph.
with tf.name_scope(layer_name):
# This Variable will hold the state of the weights for the layer
with tf.name_scope('weights'):
weights = weight_variable([input_dim, output_dim])
variable_summaries(weights, layer_name + '/weights')
with tf.name_scope('biases'):
biases = bias_variable([output_dim])
variable_summaries(biases, layer_name + '/biases')
with tf.name_scope('Wx_plus_b'):
preactivate = tf.matmul(input_tensor, weights) + biases
tf.histogram_summary(layer_name + '/pre_activations', preactivate)
activations = act(preactivate, 'activation')
tf.histogram_summary(layer_name + '/activations', activations)
return activations
hidden1 = nn_layer(x, 784, 500, 'layer1')
dropped = tf.nn.dropout(hidden1, keep_prob)
y = nn_layer(dropped, 500, 10, 'layer2', act=tf.nn.softmax)
with tf.name_scope('cross_entropy'):
diff = y_ * tf.log(y)
with tf.name_scope('total'):
cross_entropy = -tf.reduce_mean(diff)
tf.scalar_summary('cross entropy', cross_entropy)
with tf.name_scope('train'):
train_step = tf.train.AdamOptimizer(
FLAGS.learning_rate).minimize(cross_entropy)
with tf.name_scope('accuracy'):
with tf.name_scope('correct_prediction'):
correct_prediction = tf.equal(tf.argmax(y, 1), tf.argmax(y_, 1))
with tf.name_scope('accuracy'):
accuracy = tf.reduce_mean(tf.cast(correct_prediction, tf.float32))
tf.scalar_summary('accuracy', accuracy)
# Merge all the summaries and write them out to /tmp/mnist_logs (by default)
merged = tf.merge_all_summaries()
train_writer = tf.train.SummaryWriter(FLAGS.summaries_dir + '/train', sess.graph)
test_writer = tf.train.SummaryWriter(FLAGS.summaries_dir + '/test')
tf.initialize_all_variables().run()
# Train the model, and also write summaries.
# Every 10th step, measure test-set accuracy, and write test summaries
# All other steps, run train_step on training data, & add training summaries
def feed_dict(train):
"""Make a TensorFlow feed_dict: maps data onto Tensor placeholders."""
if train or FLAGS.fake_data:
xs, ys = mnist.train.next_batch(100, fake_data=FLAGS.fake_data)
k = FLAGS.dropout
else:
xs, ys = mnist.test.images, mnist.test.labels
k = 1.0
return {x: xs, y_: ys, keep_prob: k}
for i in range(FLAGS.max_steps):
if i % 10 == 0: # Record summaries and test-set accuracy
summary, acc = sess.run([merged, accuracy], feed_dict=feed_dict(False))
test_writer.add_summary(summary, i)
print('Accuracy at step %s: %s' % (i, acc))
else: # Record train set summarieis, and train
summary, _ = sess.run([merged, train_step], feed_dict=feed_dict(True))
train_writer.add_summary(summary, i)
def main(_):
if tf.gfile.Exists(FLAGS.summaries_dir):
tf.gfile.DeleteRecursively(FLAGS.summaries_dir)
tf.gfile.MakeDirs(FLAGS.summaries_dir)
train()
if __name__ == '__main__':
tf.app.run()
三. 运行结果
代码运行
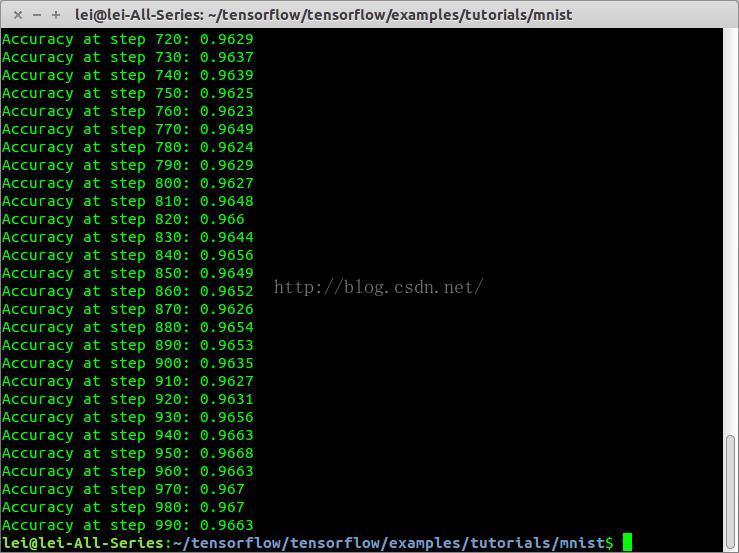
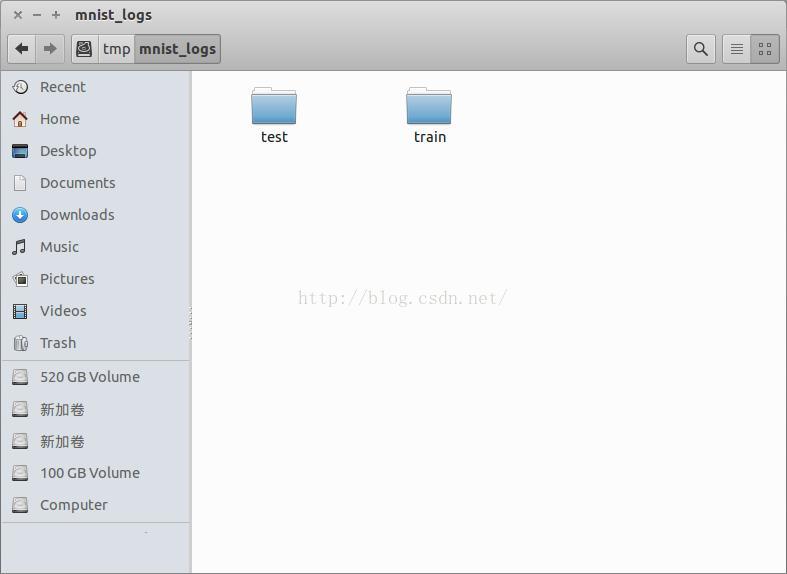
生成文件
调用TensorBoard可视化运行结果
[python] view
plain copy
tensorboard --logdir=/tmp/mnist_logs/train/

打开链接 http://0.0.0.0:6006
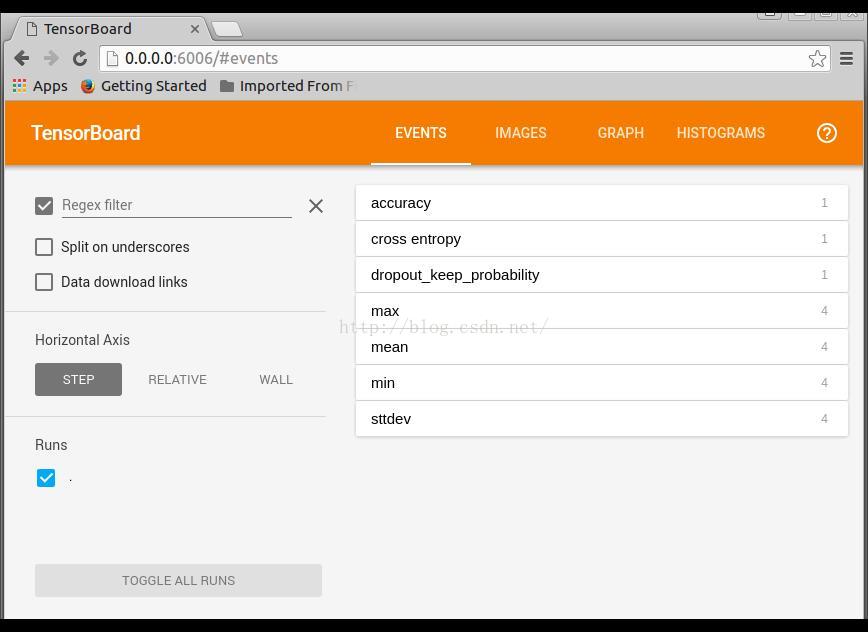
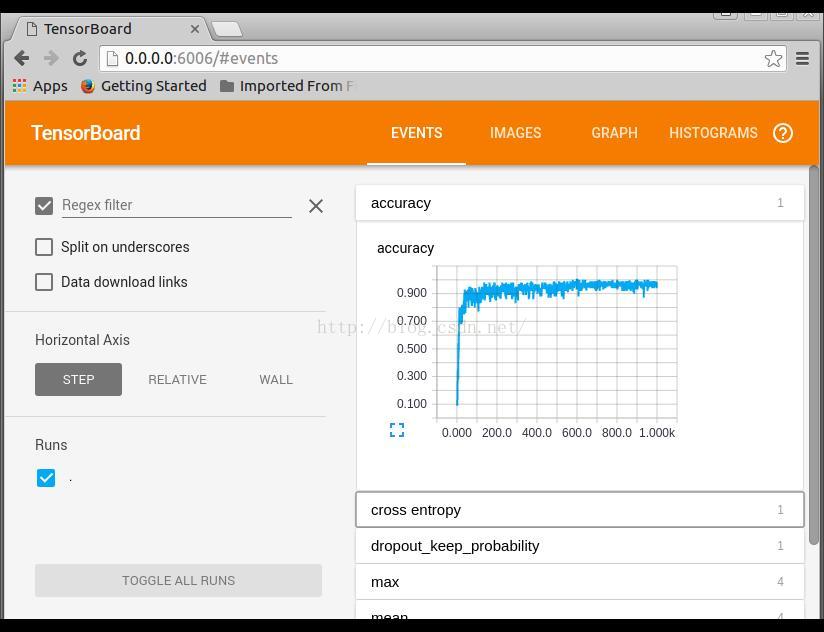
EVENTS是训练参数统计显示,可以看到整个训练过程中,各个参数的变换情况
IMAGES输入和输出标签,省略
GRAPH网络结构显示
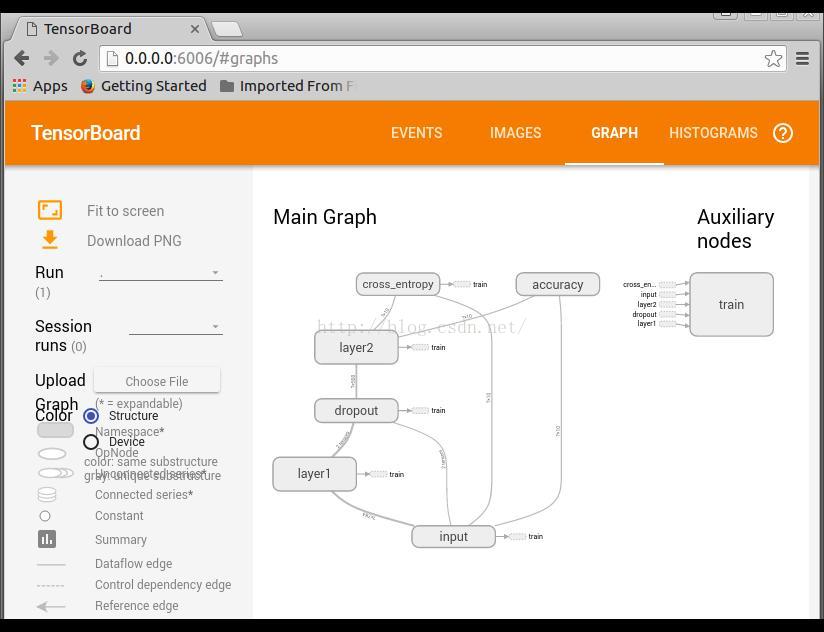
双击进去,可以显示更多的细节,包括右边的列表显示
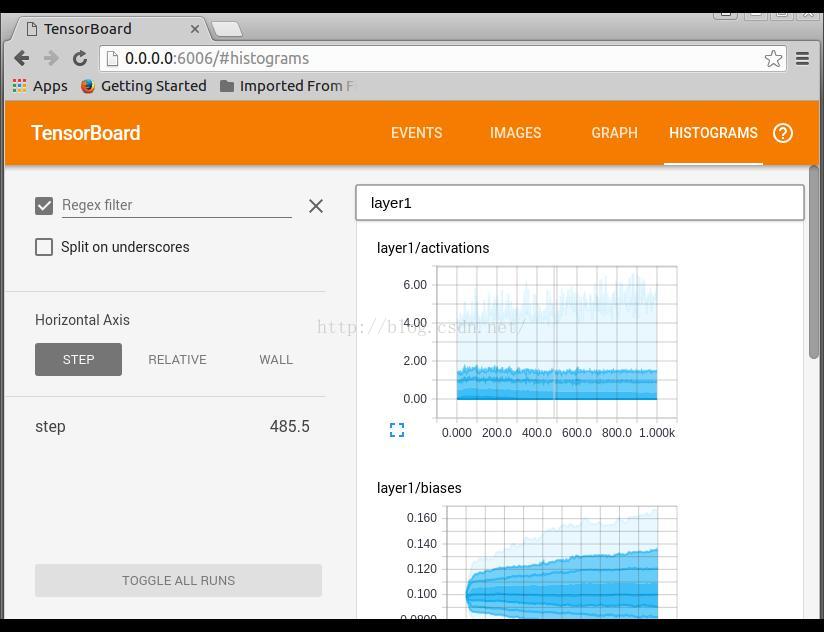
HISTOGRAM训练过程参数分布情况显示
四. 参考资料
如果你想了解更多信息,可以参考一下资料:
https://www.tensorflow.org/versions/r0.9/how_tos/summaries_and_tensorboard/index.html
https://github.com/tensorflow/tensorflow/blob/r0.9/tensorflow/tensorboard/README.md
https://github.com/tensorflow/tensorflow/blob/r0.9/tensorflow/examples/tutorials/mnist/mnist_with_summaries.py
https://www.tensorflow.org/versions/r0.9/how_tos/graph_viz/index.html
pip install tensorflow==1.0.0
----------------------------------------------------------------------------------------------------------
文章转载自:http://blog.csdn.net/helei001/article/details/51842531(何雷的博客)
在学习深度网络框架的过程中,我们发现一个问题,就是如何输出各层网络参数,用于更好地理解,调试和优化网络?针对这个问题,TensorFlow开发了一个特别有用的可视化工具包:TensorBoard,既可以显示网络结构,又可以显示训练和测试过程中各层参数的变化情况。本博文分为四个部分,第一部分介绍相关函数,第二部分是代码测试,第三部分是运行结果,第四部分介绍相关参考资料。
一. 相关函数
TensorBoard的输入是tensorflow保存summary data的日志文件。日志文件名的形式如:events.out.tfevents.1467809796.lei-All-Series 或 events.out.tfevents.1467809800.lei-All-Series。TensorBoard可读的summary
data有scalar,images,audio,histogram和graph。那么怎么把这些summary data保存在日志文件中呢?
数值如学习率,损失函数用scalar_summary函数。tf.scalar_summary(节点名称,获取的数据)
[python] view
plain copy
accuracy = tf.reduce_mean(tf.cast(correct_prediction, tf.float32))
tf.scalar_summary('accuracy', accuracy)
各层网络权重,偏置的分布,用histogram_summary函数
[python] view
plain copy
preactivate = tf.matmul(input_tensor, weights) + biases
tf.histogram_summary(layer_name + '/pre_activations', preactivate)
其他几种summary data也是同样的方式获取,只是对应的获取函数名称换一下。这些获取summary data函数节点和graph是独立的,调用的时候也需要运行session。当需要获取的数据较多的时候,我们一个一个去保存获取到的数据,以及一个一个去运行会显得比较麻烦。tensorflow提供了一个简单的方法,就是合并所有的summary
data的获取函数,保存和运行只对一个对象进行操作。比如,写入默认路径中,比如/tmp/mnist_logs (by default)
[python] view
plain copy
merged = tf.merge_all_summaries()
train_writer = tf.train.SummaryWriter(FLAGS.summaries_dir + '/train', sess.graph)
test_writer = tf.train.SummaryWriter(FLAGS.summaries_dir + '/test')
SummaryWriter从tensorflow获取summary data,然后保存到指定路径的日志文件中。以上是在建立graph的过程中,接下来执行,每隔一定step,写入网络参数到默认路径中,形成最开始的文件:events.out.tfevents.1467809796.lei-All-Series 或 events.out.tfevents.1467809800.lei-All-Series。
[python] view
plain copy
for i in range(FLAGS.max_steps):
if i % 10 == 0: # Record summaries and test-set accuracy
summary, acc = sess.run([merged, accuracy], feed_dict=feed_dict(False))
test_writer.add_summary(summary, i)
print('Accuracy at step %s: %s' % (i, acc))
else: # Record train set summarieis, and train
summary, _ = sess.run([merged, train_step], feed_dict=feed_dict(True))
train_writer.add_summary(summary, i)
二. 代码测试
[python] view
plain copy
# Copyright 2015 Google Inc. All Rights Reserved.
#
# Licensed under the Apache License, Version 2.0 (the 'License');
# you may not use this file except in compliance with the License.
# You may obtain a copy of the License at
#
# http://www.apache.org/licenses/LICENSE-2.0
#
# Unless required by applicable law or agreed to in writing, software
# distributed under the License is distributed on an 'AS IS' BASIS,
# WITHOUT WARRANTIES OR CONDITIONS OF ANY KIND, either express or implied.
# See the License for the specific language governing permissions and
# limitations under the License.
# ==============================================================================
"""A simple MNIST classifier which displays summaries in TensorBoard.
This is an unimpressive MNIST model, but it is a good example of using
tf.name_scope to make a graph legible in the TensorBoard graph explorer, and of
naming summary tags so that they are grouped meaningfully in TensorBoard.
It demonstrates the functionality of every TensorBoard dashboard.
"""
from __future__ import absolute_import
from __future__ import division
from __future__ import print_function
import tensorflow as tf
from tensorflow.examples.tutorials.mnist import input_data
flags = tf.app.flags
FLAGS = flags.FLAGS
flags.DEFINE_boolean('fake_data', False, 'If true, uses fake data '
'for unit testing.')
flags.DEFINE_integer('max_steps', 1000, 'Number of steps to run trainer.')
flags.DEFINE_float('learning_rate', 0.001, 'Initial learning rate.')
flags.DEFINE_float('dropout', 0.9, 'Keep probability for training dropout.')
flags.DEFINE_string('data_dir', '/tmp/data', 'Directory for storing data')
flags.DEFINE_string('summaries_dir', '/tmp/mnist_logs', 'Summaries directory')
def train():
# Import data
mnist = input_data.read_data_sets(FLAGS.data_dir, one_hot=True,
fake_data=FLAGS.fake_data)
sess = tf.InteractiveSession()
# Create a multilayer model.
# Input placehoolders
with tf.name_scope('input'):
x = tf.placeholder(tf.float32, [None, 784], name='x-input')
image_shaped_input = tf.reshape(x, [-1, 28, 28, 1])
tf.image_summary('input', image_shaped_input, 10)
y_ = tf.placeholder(tf.float32, [None, 10], name='y-input')
keep_prob = tf.placeholder(tf.float32)
tf.scalar_summary('dropout_keep_probability', keep_prob)
# We can't initialize these variables to 0 - the network will get stuck.
def weight_variable(shape):
"""Create a weight variable with appropriate initialization."""
initial = tf.truncated_normal(shape, stddev=0.1)
return tf.Variable(initial)
def bias_variable(shape):
"""Create a bias variable with appropriate initialization."""
initial = tf.constant(0.1, shape=shape)
return tf.Variable(initial)
def variable_summaries(var, name):
"""Attach a lot of summaries to a Tensor."""
with tf.name_scope('summaries'):
mean = tf.reduce_mean(var)
tf.scalar_summary('mean/' + name, mean)
with tf.name_scope('stddev'):
stddev = tf.sqrt(tf.reduce_sum(tf.square(var - mean)))
tf.scalar_summary('sttdev/' + name, stddev)
tf.scalar_summary('max/' + name, tf.reduce_max(var))
tf.scalar_summary('min/' + name, tf.reduce_min(var))
tf.histogram_summary(name, var)
def nn_layer(input_tensor, input_dim, output_dim, layer_name, act=tf.nn.relu):
"""Reusable code for making a simple neural net layer.
It does a matrix multiply, bias add, and then uses relu to nonlinearize.
It also sets up name scoping so that the resultant graph is easy to read, and
adds a number of summary ops.
"""
# Adding a name scope ensures logical grouping of the layers in the graph.
with tf.name_scope(layer_name):
# This Variable will hold the state of the weights for the layer
with tf.name_scope('weights'):
weights = weight_variable([input_dim, output_dim])
variable_summaries(weights, layer_name + '/weights')
with tf.name_scope('biases'):
biases = bias_variable([output_dim])
variable_summaries(biases, layer_name + '/biases')
with tf.name_scope('Wx_plus_b'):
preactivate = tf.matmul(input_tensor, weights) + biases
tf.histogram_summary(layer_name + '/pre_activations', preactivate)
activations = act(preactivate, 'activation')
tf.histogram_summary(layer_name + '/activations', activations)
return activations
hidden1 = nn_layer(x, 784, 500, 'layer1')
dropped = tf.nn.dropout(hidden1, keep_prob)
y = nn_layer(dropped, 500, 10, 'layer2', act=tf.nn.softmax)
with tf.name_scope('cross_entropy'):
diff = y_ * tf.log(y)
with tf.name_scope('total'):
cross_entropy = -tf.reduce_mean(diff)
tf.scalar_summary('cross entropy', cross_entropy)
with tf.name_scope('train'):
train_step = tf.train.AdamOptimizer(
FLAGS.learning_rate).minimize(cross_entropy)
with tf.name_scope('accuracy'):
with tf.name_scope('correct_prediction'):
correct_prediction = tf.equal(tf.argmax(y, 1), tf.argmax(y_, 1))
with tf.name_scope('accuracy'):
accuracy = tf.reduce_mean(tf.cast(correct_prediction, tf.float32))
tf.scalar_summary('accuracy', accuracy)
# Merge all the summaries and write them out to /tmp/mnist_logs (by default)
merged = tf.merge_all_summaries()
train_writer = tf.train.SummaryWriter(FLAGS.summaries_dir + '/train', sess.graph)
test_writer = tf.train.SummaryWriter(FLAGS.summaries_dir + '/test')
tf.initialize_all_variables().run()
# Train the model, and also write summaries.
# Every 10th step, measure test-set accuracy, and write test summaries
# All other steps, run train_step on training data, & add training summaries
def feed_dict(train):
"""Make a TensorFlow feed_dict: maps data onto Tensor placeholders."""
if train or FLAGS.fake_data:
xs, ys = mnist.train.next_batch(100, fake_data=FLAGS.fake_data)
k = FLAGS.dropout
else:
xs, ys = mnist.test.images, mnist.test.labels
k = 1.0
return {x: xs, y_: ys, keep_prob: k}
for i in range(FLAGS.max_steps):
if i % 10 == 0: # Record summaries and test-set accuracy
summary, acc = sess.run([merged, accuracy], feed_dict=feed_dict(False))
test_writer.add_summary(summary, i)
print('Accuracy at step %s: %s' % (i, acc))
else: # Record train set summarieis, and train
summary, _ = sess.run([merged, train_step], feed_dict=feed_dict(True))
train_writer.add_summary(summary, i)
def main(_):
if tf.gfile.Exists(FLAGS.summaries_dir):
tf.gfile.DeleteRecursively(FLAGS.summaries_dir)
tf.gfile.MakeDirs(FLAGS.summaries_dir)
train()
if __name__ == '__main__':
tf.app.run()
三. 运行结果
代码运行
生成文件
调用TensorBoard可视化运行结果
[python] view
plain copy
tensorboard --logdir=/tmp/mnist_logs/train/
打开链接 http://0.0.0.0:6006
EVENTS是训练参数统计显示,可以看到整个训练过程中,各个参数的变换情况
IMAGES输入和输出标签,省略
GRAPH网络结构显示
双击进去,可以显示更多的细节,包括右边的列表显示
HISTOGRAM训练过程参数分布情况显示
四. 参考资料
如果你想了解更多信息,可以参考一下资料:
https://www.tensorflow.org/versions/r0.9/how_tos/summaries_and_tensorboard/index.html
https://github.com/tensorflow/tensorflow/blob/r0.9/tensorflow/tensorboard/README.md
https://github.com/tensorflow/tensorflow/blob/r0.9/tensorflow/examples/tutorials/mnist/mnist_with_summaries.py
https://www.tensorflow.org/versions/r0.9/how_tos/graph_viz/index.html

相关文章推荐
- TensorBoard可视化网络结构和参数Tensorboard windows显示空白
- 学习TensorFlow,TensorBoard可视化网络结构和参数
- 学习TensorFlow,TensorBoard可视化网络结构和参数
- Tensorflow学习教程------tensorboard网络运行和可视化
- TensorBoard可视化结构管理工具在Windows下的使用
- TensotFlow 应用实例:08-使用tensorboard可视化神经网络结构和训练结果
- Windows系统下Tensorboard显示空白的问题
- Windows 上 Tensorboard显示空白问题
- TensorFlow基础笔记(9) Tensorboard可视化显示
- Windows下 tensorboard显示空白 以及 No graph definition files were found的问题解决
- Tensorflow搭建神经网络及使用Tensorboard进行可视化
- 深度学习框架TensorFlow学习与应用(五)——TensorBoard结构与可视化
- Windows下tensorboard显示空白问题
- TensorFlow学习--TensorBoard神经网络可视化
- TensorFlow利用普通神经网络识别MNIST以及tensorboard可视化
- DL | 快速使用Tensorboard可视化模型参数和模型结构
- 深度学习框架TensorFlow学习与应用(五)——TensorBoard结构与可视化
- 【TensorFlow】 TensorBoard不显示
- tensorboard无法显示的原因(在Windows下)
- 学习TensorFlow,保存学习到的网络结构参数并调用