520比心大法,用MATLAB绘制心形,用c++绘制心形
2017-05-20 09:38
381 查看
MATLAB:
1、clear all;
clc;
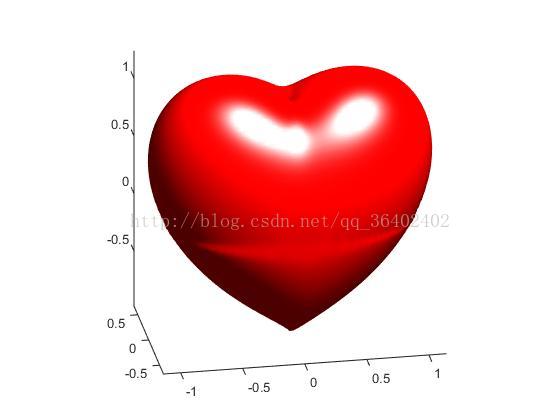
[X,Y,Z]=meshgrid(linspace(-1.3,1.3));
val=(X.^2+(9/4)*Y.^2+Z.^2-1).^3-X.^2.*Z.^3-(9/80)*Y.^2.*Z.^3;
isosurface(X,Y,Z,val,0)
axis equal
view(-10,24)
colormap flag
camlight
lighting phong
2、clear all;
clc;
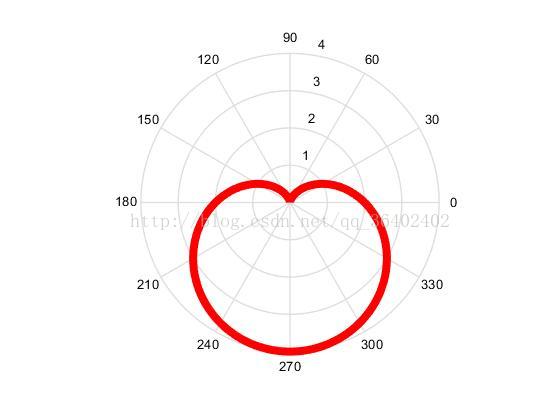
theta=0:0.01*pi:2*pi;
a=2;
r=a*(1-sin(theta));
h0=polar(theta,r,'r');
set(h0,'LineWidth',6);
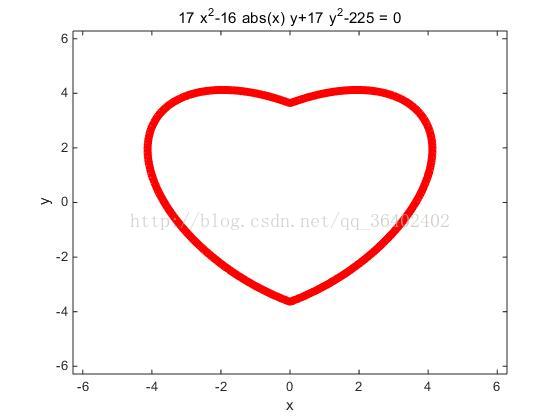
3、h0=ezplot('17*x^2-16*abs(x)*y+17*y^2-225');
set(h0,'color','r','LineWidth',6);
4、clear all;
clc;
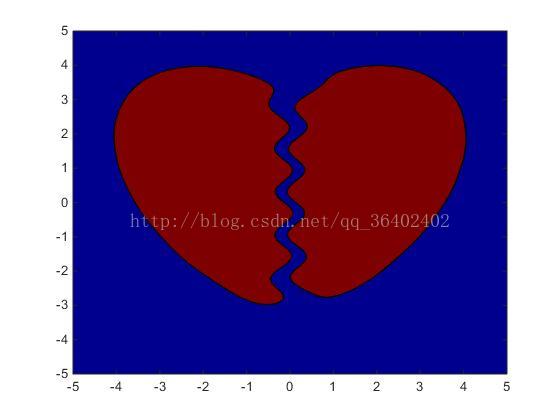
[x,y]=meshgrid(-5:0.01:5,-5:0.01:5);
v=17*x.^2-16*abs(x).*y+17*y.^2+150./abs(5*x+sin(5*y))<225;
contourf(x,y,v);
colormap(jet);
5、clear all;
clc;
% Initialize the volume data, figure, and axes:
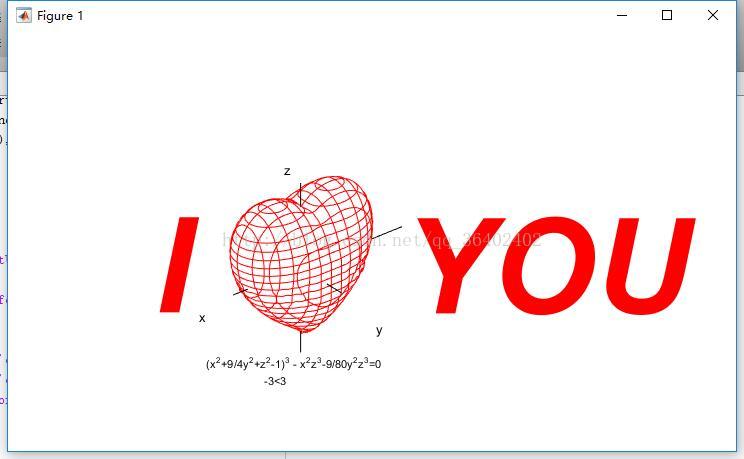
[X,Y,Z] = meshgrid(linspace(-3,3,101));
F = -X.^2.*Z.^3-(9/80).*Y.^2.*Z.^3+(X.^2+(9/4).*Y.^2+Z.^2-1).^3;
hFigure = figure;
sz = get(hFigure, 'Position');
set(hFigure, 'Position', [sz(1)-0.15*sz(3) sz(2) 1.3*sz(3) sz(4)]);
set(hFigure,'color','w', 'menu','none')
hAxes = axes('Parent',hFigure,'NextPlot','add',...
'DataAspectRatio',[1 1 1],...
'XLim',[30 120],'YLim',[35 65],'ZLim',[30 75]);
view([-39 30]);
axis off
% hidden surface removal
hidden on
% Fill the inside of the mesh with an isosurface to
% block rendering of the back side of the heart
p = patch(isosurface(F,-0.001));
set(p,'FaceColor','w','EdgeColor','none');
% Create and plot contours in the y-z plane:
for iX = [35 38 41 45 48 51 54 57 61 64 67]
plane = reshape(F(:,iX,:),101,101);
cData = contourc(plane,[0 0]);
xData = iX.*ones(1,cData(2,1));
h3=plot3(hAxes,xData,cData(2,2:end),cData(1,2:end),'k');
set(h3,'color','r');
pause(.1), drawnow
end
% Create and plot contours in the x-z plane:
for iY = [41 44 47 51 55 58 61]
plane = reshape(F(iY,:,:),101,101);
cData = contourc(plane,[0 0]);
yData = iY.*ones(1,cData(2,1));
h4=plot3(hAxes,cData(2,2:end),yData,cData(1,2:end),'k');
set(h4,'color','r');
pause(.1), drawnow
end
% Create and plot contours in the x-y plane:
for iZ = [36 38 40 42 44 46 48 50 52 54 56 58 60 62 64 66 69 71]
plane = F(:,:,iZ);
cData = contourc(plane,[0 0]);
startIndex = 1;
if size(cData,2) > (cData(2,1)+1)
startIndex = cData(2,1)+2;
zData = iZ.*ones(1,cData(2,1));
h0=plot3(hAxes,cData(1,2:(startIndex-1)),...
cData(2,2:(startIndex-1)),zData,'k');
set(h0,'color','r');
end
zData = iZ.*ones(1,cData(2,startIndex));
h1=plot3(hAxes,cData(1,(startIndex+1):end),...
cData(2,(startIndex+1):end),zData,'k');
set(h1,'color','r');
pause(.1), drawnow
end
pause(.2)
text(7,50,70,'I', 'color','r','fontWeight','bold','FontAngle','italic','fontsize',100)
pause(.5)
text(80,50,43,'YOU','color','r' ,'fontWeight','bold','FontAngle','italic','fontsize',100)
pause(.2)
line([20 80],[50 50],[52.5 52.5], 'color','k')
line([50 50],[20 80],[52.5 52.5], 'color','k')
line([50 50],[50 50],[30 80], 'color','k')
text(20,50,50,'x')
text(48,20,50,'y')
text(45,50,80,'z')
text(30,60,30,'(x^2+9/4y^2+z^2-1)^3 - x^2z^3-9/80y^2z^3=0', 'fontsize',8)
text(35,45,30,'-3<3', 'fontsize',8)
C++
1、#include <stdio.h>
void print_love()
{
printf(" ****** ******\n");
printf(" ********** **********\n");
printf(" ************* *************\n");
printf(" *****************************\n");
printf(" *****************************\n");
printf(" *****************************\n");
printf(" ***************************\n");
printf(" ***********************\n");
printf(" *******************\n");
printf(" ***************\n");
printf(" ***********\n");
printf(" *******\n");
printf(" ***\n");
printf(" *\n");
}
int main()
{
print_love();
return 0;}

1、clear all;
clc;
[X,Y,Z]=meshgrid(linspace(-1.3,1.3));
val=(X.^2+(9/4)*Y.^2+Z.^2-1).^3-X.^2.*Z.^3-(9/80)*Y.^2.*Z.^3;
isosurface(X,Y,Z,val,0)
axis equal
view(-10,24)
colormap flag
camlight
lighting phong
2、clear all;
clc;
theta=0:0.01*pi:2*pi;
a=2;
r=a*(1-sin(theta));
h0=polar(theta,r,'r');
set(h0,'LineWidth',6);
3、h0=ezplot('17*x^2-16*abs(x)*y+17*y^2-225');
set(h0,'color','r','LineWidth',6);
4、clear all;
clc;
[x,y]=meshgrid(-5:0.01:5,-5:0.01:5);
v=17*x.^2-16*abs(x).*y+17*y.^2+150./abs(5*x+sin(5*y))<225;
contourf(x,y,v);
colormap(jet);
5、clear all;
clc;
% Initialize the volume data, figure, and axes:
[X,Y,Z] = meshgrid(linspace(-3,3,101));
F = -X.^2.*Z.^3-(9/80).*Y.^2.*Z.^3+(X.^2+(9/4).*Y.^2+Z.^2-1).^3;
hFigure = figure;
sz = get(hFigure, 'Position');
set(hFigure, 'Position', [sz(1)-0.15*sz(3) sz(2) 1.3*sz(3) sz(4)]);
set(hFigure,'color','w', 'menu','none')
hAxes = axes('Parent',hFigure,'NextPlot','add',...
'DataAspectRatio',[1 1 1],...
'XLim',[30 120],'YLim',[35 65],'ZLim',[30 75]);
view([-39 30]);
axis off
% hidden surface removal
hidden on
% Fill the inside of the mesh with an isosurface to
% block rendering of the back side of the heart
p = patch(isosurface(F,-0.001));
set(p,'FaceColor','w','EdgeColor','none');
% Create and plot contours in the y-z plane:
for iX = [35 38 41 45 48 51 54 57 61 64 67]
plane = reshape(F(:,iX,:),101,101);
cData = contourc(plane,[0 0]);
xData = iX.*ones(1,cData(2,1));
h3=plot3(hAxes,xData,cData(2,2:end),cData(1,2:end),'k');
set(h3,'color','r');
pause(.1), drawnow
end
% Create and plot contours in the x-z plane:
for iY = [41 44 47 51 55 58 61]
plane = reshape(F(iY,:,:),101,101);
cData = contourc(plane,[0 0]);
yData = iY.*ones(1,cData(2,1));
h4=plot3(hAxes,cData(2,2:end),yData,cData(1,2:end),'k');
set(h4,'color','r');
pause(.1), drawnow
end
% Create and plot contours in the x-y plane:
for iZ = [36 38 40 42 44 46 48 50 52 54 56 58 60 62 64 66 69 71]
plane = F(:,:,iZ);
cData = contourc(plane,[0 0]);
startIndex = 1;
if size(cData,2) > (cData(2,1)+1)
startIndex = cData(2,1)+2;
zData = iZ.*ones(1,cData(2,1));
h0=plot3(hAxes,cData(1,2:(startIndex-1)),...
cData(2,2:(startIndex-1)),zData,'k');
set(h0,'color','r');
end
zData = iZ.*ones(1,cData(2,startIndex));
h1=plot3(hAxes,cData(1,(startIndex+1):end),...
cData(2,(startIndex+1):end),zData,'k');
set(h1,'color','r');
pause(.1), drawnow
end
pause(.2)
text(7,50,70,'I', 'color','r','fontWeight','bold','FontAngle','italic','fontsize',100)
pause(.5)
text(80,50,43,'YOU','color','r' ,'fontWeight','bold','FontAngle','italic','fontsize',100)
pause(.2)
line([20 80],[50 50],[52.5 52.5], 'color','k')
line([50 50],[20 80],[52.5 52.5], 'color','k')
line([50 50],[50 50],[30 80], 'color','k')
text(20,50,50,'x')
text(48,20,50,'y')
text(45,50,80,'z')
text(30,60,30,'(x^2+9/4y^2+z^2-1)^3 - x^2z^3-9/80y^2z^3=0', 'fontsize',8)
text(35,45,30,'-3<3', 'fontsize',8)
C++
1、#include <stdio.h>
void print_love()
{
printf(" ****** ******\n");
printf(" ********** **********\n");
printf(" ************* *************\n");
printf(" *****************************\n");
printf(" *****************************\n");
printf(" *****************************\n");
printf(" ***************************\n");
printf(" ***********************\n");
printf(" *******************\n");
printf(" ***************\n");
printf(" ***********\n");
printf(" *******\n");
printf(" ***\n");
printf(" *\n");
}
int main()
{
print_love();
return 0;}

相关文章推荐
- 【matlab】 动态绘制三维心形图
- 用Matlab与c++程序生成的数据文件绘制sin函数
- C/C++ 和 Java 命令行绘制心形图案
- c++调用matlab(2)
- 快速傅立叶变换(FFT)的C++实现与Matlab实验
- 由滤波器系数绘制尺度函数和小波函数图像的Matlab程序
- VC++中使用MATLAB的C++数学库和MCC生成的程序(转)
- 使用C++绘制算法弥补.net图形绘制缺陷
- MATLAB结合C/C++建立独立的应用程序(2)
- C++调用matlab时可能遇到的问题和相关设置
- C++与matlab混合编程基于主成份分析算法的数值分析(一)
- MATLAB结合C/C++建立独立的应用程序
- 4.4 绘制根轨迹的MATLAB函数
- FORCAL与C/C++、MATLAB、Python、Lua等各种语言的速度比较
- matlab入门1--利用plot函数绘制正弦函数图形
- c++调用matlab
- Matlab与C++联合编程软件MATCom安装与设置及下载
- VC++中使用MATLAB的C++数学库和MCC生成的程序(转)
- MatLab中函数图形的绘制
- 使用matlab作为图表绘制工具--Matlab使用入门