linux服务器性能(网卡流量、CPU、内存、磁盘使用率)监控
2017-05-07 11:17
841 查看
转载请注明:http://www.cnblogs.com/zishengY/p/6819606.html
广义的网站的监控涵盖所有的非业务行为的数据采集与管理,包括数据分析师和产品设计师使用的网站用户行为日志、业务运行数据,以及供运维工程师和开发工程师使用的性能统计数据等。
本文主要是通过shell脚本来收集服务器性能指标,如系统load、内存占用、磁盘IO、CPU占用,并将其写入一个文件中,及时判断应用情况,防患于未然 。
实现步骤如下:
第一步:编写shell脚本,如下:
vim check.sh,添加下面脚本之后保存
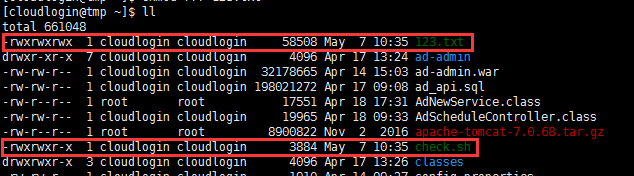
第四步:执行check.sh脚本
./check.sh

第五步:查看执行写入文件的情况
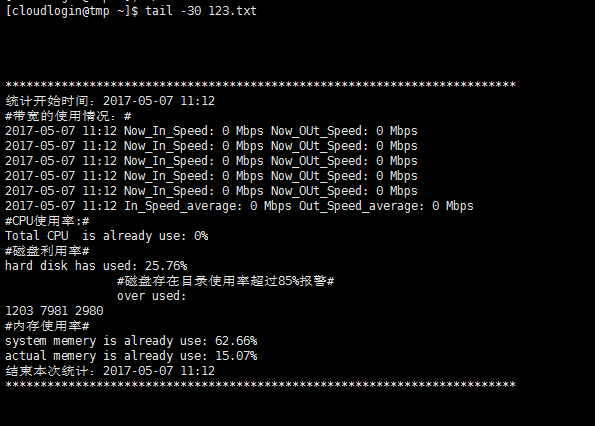
出现这信息表名脚本成功运行实时统计情况。
若是想使用定时任务,可使用crontab进行设置,请参见这篇文章
crontab的两种配置方式
广义的网站的监控涵盖所有的非业务行为的数据采集与管理,包括数据分析师和产品设计师使用的网站用户行为日志、业务运行数据,以及供运维工程师和开发工程师使用的性能统计数据等。
本文主要是通过shell脚本来收集服务器性能指标,如系统load、内存占用、磁盘IO、CPU占用,并将其写入一个文件中,及时判断应用情况,防患于未然 。
实现步骤如下:
第一步:编写shell脚本,如下:
vim check.sh,添加下面脚本之后保存
1 #!/bin/bash
2 #这个脚本使用来统计CPU、磁盘、内存使用率、带宽的
3 #初始化一些下面用到的变量
4 total=0
5 system=0
6 user=0
7 i=0
8
9 time=`date "+%Y-%m-%d %k:%M"`
10 day=`date "+%Y-%m-%d"`
11 minute=`date "+%k:%M"`
12 echo  "*************************************************************************" >> 123.txt
13 echo "统计开始时间:$day $minute" >> 123.txt
14
15 #带宽使用情况
 16 echo "#带宽的使用情况:#" >>123.txt
17 #循环五次,避免看到的是偶然的数据
18 while (( $i<5 ))
19 do
20 #原先的`ifconfig eth0|sed -n "7p"|awk '{print $2}'|cut -c7-`方式获取网卡的信息为空,已经注释掉
21 #rx_before=`ifconfig eth0|sed -n "7p"|awk '{print $2}'|cut -c7-`
22 #tx_before=`ifconfig eth0|sed -n "7p"|awk '{print $6}'|cut -c7-`
23 rx_before=$(cat /proc/net/dev | grep 'eth' | tr : " " | awk '{print $2}')
24 tx_before=$(cat /proc/net/dev | grep 'eth' | tr : " " | awk '{print $10}')
25 #休眠2s
26 sleep 2
27 #用sed先获取第7列,再用awk获取第2列,再cut切割,从第7个到最后,即只切割网卡流量数字部分
28 #rx_after=`ifconfig eth0|sed -n "7p"|awk '{print $2}'|cut -c7-`
29 #tx_after=`ifconfig eth0|sed -n "7p"|awk '{print $6}'|cut -c7-`
30 rx_after=$(cat /proc/net/dev | grep 'eth' | tr : " " | awk '{print $2}')
31 tx_after=$(cat /proc/net/dev | grep 'eth' | tr : " " | awk '{print $10}')
32 #注意下面截取的相差2秒的两个时刻的累计和发送的bytes(即累计传送和接受的位)
33 rx_result=$[(rx_after-rx_before)/1024/1024/2*8]
34 tx_result=$[(tx_after-tx_before)/1024/1024/2*8]
35 echo  "$time Now_In_Speed: $rx_result Mbps Now_OUt_Speed: $tx_result Mbps" >>123.txt
36 let "i++"
37 done
38 #注意下面grep后面的$time变量要用双引号括起来
39 rx_result=$(cat 123.txt|grep "$time"|awk '{In+=$4}END{print In}')
40 tx_result=$(cat 123.txt|grep "$time"|awk '{Out+=$7}END{print Out}')
41 In_Speed=$(echo "scale=2;$rx_result/5"|bc)
42 Out_Speed=$(echo "scale=2;$tx_result/5"|bc)
43 #echo "#带宽的5次的平均值是:#" >>123.txt
44 echo  "$time In_Speed_average: $In_Speed Mbps Out_Speed_average: $Out_Speed Mbps" >>123.txt
45
46
47 #CPU使用情况
 48 #使用vmstat 1 5命令统计5秒内的使用情况,再计算每秒使用情况
49 which sar > /dev/null 2>&1
50 if [ $? -ne 0 ]
51 then
52   total=`vmstat 1 5|awk '{x+=$13;y+=$14}END{print x+y}'`
53   average=$(echo "scale=2;$total/5"|bc)
54 fi
55 echo "#CPU使用率:#" >>123.txt
56 echo "Total CPU  is already use: $average%" >>123.txt
57
58
59 #磁盘使用情况(注意:需要用sed先进行格式化才能进行累加处理)
 60 disk_used=$(df -m | sed '1d;/ /!N;s/\n//;s/ \+/ /;' | awk '{used+=$3} END{print used}')
61 disk_totalSpace=$(df -m | sed '1d;/ /!N;s/\n//;s/ \+/ /;' | awk '{totalSpace+=$2} END{print totalSpace}')
62 disk_all=$(echo "scale=4;$disk_used/$disk_totalSpace" | bc)
63 disk_percent1=$(echo $disk_all | cut -c 2-3)
64 disk_percent2=$(echo $disk_all | cut -c 4-5)
65 disk_warning=`df -m | sed '1d;/ /!N;s/\n//;s/ \+/ /;' | awk '{if ($5>85) print $5 $6;} '`
66 echo "#磁盘利用率#" >>123.txt
67 echo "hard disk has used: $disk_percent1.$disk_percent2%" >>123.txt
68 #echo -e "\t\t.." 表示换行
69 echo -e "\t\t#磁盘存在目录使用率超过85%报警#" >>123.txt
70 echo -e "\t\tover used: $disk_warning" >>123.txt
71
72
73 #内存使用情况
 74 #获得系统总内存
75 memery_all=$(free -m | awk 'NR==2' | awk '{print $2}')
76 #获得占用内存(操作系统 角度)
77 system _memery_used =$(free -m | awk 'NR==2' | awk '{print $3}')
78 #获得buffer、cache占用内存,当内存不够时会及时回收,所以这两部分可用于可用内存的计算
79 buffer_used=$(free -m | awk 'NR==2' | awk '{print $6}')
80 cache_used=$(free -m | awk 'NR==2' | awk '{print $7}')
81 #获得被使用内存,所以这部分可用于可用内存的计算,注意计算方法
82 actual_used_all =$[memery_all-(free+buffer_used+cache_used)]
83 #获得实际占用的内存
84 actual_used_all=`expr $memery_all - $free + $buffer_used + $cache_used `
85 echo "$used_all" >> 123.txt
86 memery_percent=$(echo "scale=4;$system _memery_used / $memery_all" | bc)
87 memery_percent2=$(echo "scale=4; $actual_used_all / $memery_all" | bc)
88 percent_part1=$(echo $memery_percent | cut -c 2-3)
89 percent_part2=$(echo $memery_percent | cut -c 4-5)
90 percent_part11=$(echo $memery_percent2 | cut -c 2-3)
91 percent_part22=$(echo $memery_percent2 | cut -c 4-5)
92 echo "#内存使用率#" >> 123.txt
93 #获得占用内存(操作系统角度)
94 echo "system memery is already use: $percent_part1.$percent_part2%" >>123.txt
95 #获得实际内存占用率
96 echo "actual memery is already use: $percent_part11.$percent_part22%" >>123.txt
97 echo "buffer is already used : $buffer_used M" >>123.txt
98 echo "cache is already used : $cache_used M" >>123.txt
99
100
101 echo  "结束本次统计:$day $minute" >> 123.txt
102 echo  "*************************************************************************" >> 123.txt
103 echo -e "\n\n\n\n" >> 123.txt
第二步:创建shell脚本中用到的文件123.txt touch 123.txt 第三步:给check.sh和123.txt授予所有权限 chmod 777 check.sh chmod 777 123.txt
第四步:执行check.sh脚本
./check.sh
第五步:查看执行写入文件的情况
出现这信息表名脚本成功运行实时统计情况。
若是想使用定时任务,可使用crontab进行设置,请参见这篇文章
crontab的两种配置方式

相关文章推荐
- linux服务器性能——CPU、内存、流量、磁盘使用率的监控
- Python功能模块之psutil------ Linux性能(CPU、磁盘、内存、网卡)监控
- python功能模块之psutil------ Linux性能(CPU、磁盘、内存、网卡)监控
- Python 写的几个监控脚本(CPU,内存,网卡流量,负载,磁盘空间)
- AIX和LINUX主机 CPU 内存 磁盘使用率监控
- linux系统CPU,内存,磁盘,网络流量监控脚本
- Linux服务器CPU 内存 磁盘 监控SHELL脚本
- 编程实现获取linux服务器cpu、内存和磁盘使用率
- 在FreeBSD平台下使用mrtg来监控cpu、内存、交换分区、TCP连接以及本机网卡流量
- 使用snmp+mrtg监控CPU、流量、磁盘空间、内存
- 获取linux服务器性能CPU、内存、硬盘等使用率 PHP
- 获取linux服务器性能CPU、内存、硬盘等使用率 PHP
- linux系统CPU,内存,磁盘,网络流量监控脚本
- 使用snmp+mrtg监控CPU、流量、磁盘空间、内存
- 获取linux服务器性能CPU、内存、硬盘等使用率 PHP
- 使用snmp+mrtg监控CPU、流量、磁盘空间、内存
- linux系统CPU,内存,磁盘,网络流量监控脚本
- linux系统CPU,内存,磁盘,网络流量监控脚本
- 利用shell监控cpu、磁盘、内存使用率
- Linux服务器性能评估(cpu,内存,磁盘IO)