通过日志定位分析接口调用缓慢的原因
2017-04-20 00:00
225 查看
最近我们的接口中有两个被调用的时候比较缓慢,一个查询大概需要2-3秒的样子,我们需要定位一下具体需要的时间秒数,就让某猿过去实现了。提交代码我review的时候我吓了一跳,那那两个类进行了手动统计时间,代码就不贴了,这样十分不好啊,如果以后要统计其他的controller或者service那就得手动再写,所以我重写了一份
我们需要对service以及controller进行统计,所以在springmvc.xml以及application-service.xml中都要开启aspectj 注解
在这里我们使用@Around通知来进行针对service的切面拦截,
这里就写的十分简单了,针对不同的耗时分别输出打印日志的类型
有部分朋友喜欢把数据保存到数据库中,其实我不推荐,最好是存入mongodb中即可,一来减少数据库压力,一来便于日后对日志进行分析统计以及报表制作。
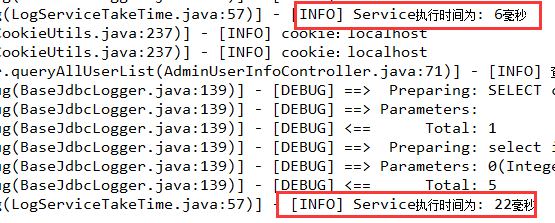
最后的输出是这样的
我们需要对service以及controller进行统计,所以在springmvc.xml以及application-service.xml中都要开启aspectj 注解
<!-- 自动创建代理 对@AspectJ注解的支持 -->
<!-- 通知spring使用cglib而不是jdk的来生成代理方法 AOP可以拦截到Controller -->
<aop:aspectj-autoproxy proxy-target-class="true"></aop:aspectj-autoproxy>
在这里我们使用@Around通知来进行针对service的切面拦截,
@Aspect @Component public class LogServiceTakeTime { final static Logger log = LoggerFactory.getLogger(LogServiceTakeTime.class); @Pointcut("execution(* com.javasxy.service..*.*(..))") // @Pointcut("execution(* com.javasxy.web.controller.*.*(..))")
public void performance(){ } @Around("performance()") public Object doLog(ProceedingJoinPoint joinPoint) throws Throwable { //记录起始时间
long begin = System.currentTimeMillis(); Object result = ""; /** 执行目标方法 */
try{ result= joinPoint.proceed(); } catch(Exception e){ log.error("日志记录发生错误, errorMessage: {}", e.getMessage()); } finally{ /** 记录操作时间 */
long took = System.currentTimeMillis() - begin; if (took > 5000) { log.error("Service 执行时间为: {}毫秒", took); // l
7fe0
og.error("Controller 执行时间为: {}毫秒", took);
} else if (took > 2000) { log.warn("Service 执行时间为: {}毫秒", took); // log.warn("Controlle r执行时间为: {}毫秒", took);
} else { log.info("Service执行时间为: {}毫秒", took); // log.info("Controller 执行时间为: {}毫秒", took);
} // TODO 日志保存到MongoDB中
} return result; } }
这里就写的十分简单了,针对不同的耗时分别输出打印日志的类型
有部分朋友喜欢把数据保存到数据库中,其实我不推荐,最好是存入mongodb中即可,一来减少数据库压力,一来便于日后对日志进行分析统计以及报表制作。
最后的输出是这样的

相关文章推荐
- 通过日志定位分析接口调用缓慢的原因
- 无法分析从服务器收到的消息。之所以出现此错误,常见的原因是: 在通过调用 Response.Write() 修改响应时,将启用响应筛选器、HttpModule 或服务器跟踪
- 短信发送接口被恶意访问的网络攻击事件(三)定位恶意IP的日志分析脚本
- PHP调用MFC ActiveX控件接口时产生致命错误原因分析
- hadoop日志分析系统三 最终通过Web接口与用户交互
- 无法分析从服务器收到的消息。之所以出现此错误,常见的原因是: 在通过调用 Response.Write() 修改响应时,将启用响应筛选器、HttpModule 或服务器跟踪。
- 工作日志——首次通过k8s Elasticsearch获取新建Pod的日志缓慢的原因
- mongodb Profiling 通过慢查询日志分析查询慢的原因 相应优化
- Spring AOP在函数接口调用性能分析及其日志处理方面的应用
- 无法分析从服务器收到的消息。之所以出现此错误,常见的原因是: 在通过调用 Response.Write() 修改响应时,将启用响应筛选器、HttpModule 或服务器跟踪。
- mongodb Profiling 通过慢查询日志分析查询慢的原因 相应优化
- 无法分析从服务器收到的消息。之所以出现此错误,常见的原因是: 在通过调用 Response.Write() 修改响应时,将启用响应筛选器、HttpModule 或服务器跟踪。
- 无法分析从服务器收到的消息。之所以出现此错误,常见的原因是: 在通过调用 Response.Write() 修改响
- 短信发送接口被恶意访问的网络攻击事件(三)定位恶意IP的日志分析脚本
- Spring AOP在函数接口调用性能分析及其日志处理方面的应用
- 案例分享:如何通过JVM crash 的日志和core dump定位和分析Instrument引起的JVM crash
- 无法分析从服务器收到的消息。之所以出现此错误,常见的原因是: 在通过调用 Response.Write() 修改响应时,将启用响应筛选器、HttpModule 或服务器跟踪。
- 无法分析从服务器收到的消息。之所以出现此错误,常见的原因是: 在通过调用 Response.Write() 修改响应时,将启用响应筛选器、HttpModule 或服务器跟踪。
- 通过自动化接口调用InstallShield 报错的解决办法
- SSCLI中GC源码分析(1) - EE与BCL之间的调用接口FCall