tensorflow学习笔记十五:tensorflow官方文档学习 TensorBoard: Graph Visualization
2017-03-19 15:55
1256 查看
tensorflow计算图是强大而复杂的。图形可视化可以帮助您理解和调试它们。下面是一个可视化工作的例子。

Visualization
of a TensorFlow graph.
看看自己的图,运行tensorboard指向它的工作日志目录,点击图”选项卡在顶部窗格中,在左上角用菜单选择合适的运行。在深度信息如何运行tensorboard确保你记录所有必要的信息,看see TensorBoard:
Visualizing Learning.。
典型的tensorflow图可以有多个节点,很容易看到一下子太多,甚至制定使用标准的图形工具。为了简化,变量名可以范围和可视化使用此信息来对图中的节点定义一个层次。默认情况下,只有该层次结构的顶部显示。这里有一个例子,在hidde层定义了三种业务范围使用tf.name_scope下的名字:
This results in the following three op names:
默认情况下,可视化将将所有三个节点标记为隐藏的节点。额外的细节不会丢失。你可以双击或点击扩展节点的右上方的橙色+符号,然后你会看到三个子节点,alpha,weights,and bias.
这里是一个现实的例子,一个更复杂的节点在其初始和扩展状态。
按名称范围对节点进行分组是生成清晰图形的关键。如果你正在建立一个模型,名字域给你控制结果可视化。你的名字范围越大,你的形象就越好。
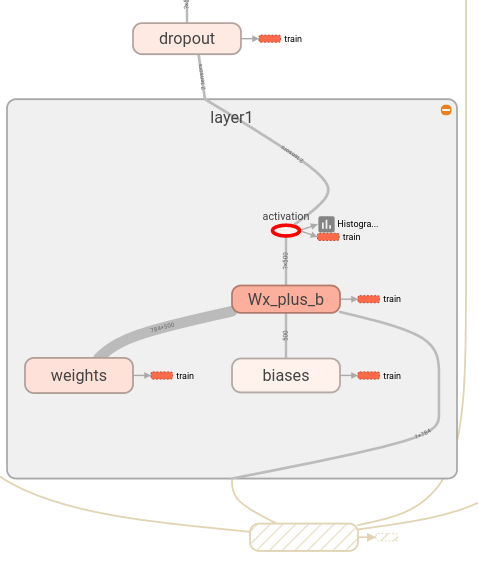
上面的图说明了可视化的第二个方面。tensorflow图有两种连接方式:数据依赖和控制依赖关系。数据依赖关系显示两个OPS之间的张量流,并显示为实心箭头,而控件依赖性使用虚线。在扩展视图(右上图)所有的连接都是数据依赖,除了用虚线连接的checknumerics和control_dependency。
还有第二个技巧来简化布局。大多数tensorflow图几个节点都会与其他节点相连接。例如,许多节点可能对初始化步骤具有控制依赖性。绘制init节点及其依赖项之间的所有边缘将创建一个非常杂乱的视图。
为了减少杂波,可视化分离出所有的高度节点右侧的辅助区域,不画线来表示其边缘。我们画小节点图标,以指示连接。分离出辅助节点通常不会删除关键信息,因为这些节点通常与记账功能有关。查看如何在主图和辅助区域之间移动节点的交互。
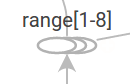
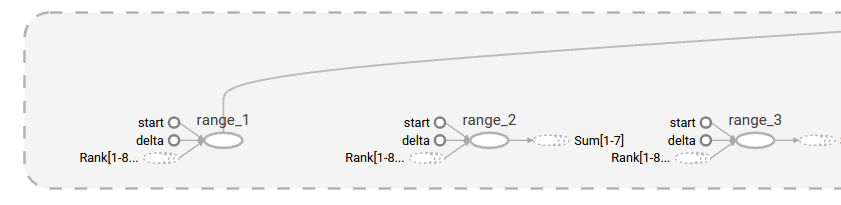
最后一个结构简化是串联倒塌。序列基序-即,节点的名称不同在最后的数字部分且拥有同构结构-被折叠成一个单一的堆栈节点,如下所示。对于具有长序列的网络,这大大简化了视图。与层次节点,双击扩展系列。查看如何为特定的节点集禁用/启用系列崩溃。
最后,作为最后一个援助的易读性,可视化使用特殊的图标为常数和总结结。总结一下,这里有一个节点符号表:
通过平移和缩放导航图形。单击并拖动到泛,并使用滚动手势缩放。双击某个节点,或单击其“+”按钮,展开表示一组操作的名称范围。很容易地跟踪当前的观点时,缩放和平移,在右下角的小地图。
要关闭打开的节点,请双击它或单击它的按钮。您也可以单击一次选择一个节点。它会变成一个更暗的颜色,它和它连接的节点的细节将出现在信息卡的右上角的可视化。
tensorboard提供改变图形的视觉布局的几种方法。这并没有改变图形的计算语义,但它可以带来一些清晰的网络结构。通过右击该节点的信息卡底部的节点或按下按钮,您可以对其布局进行如下更改:
Nodes can be moved between the main graph and the auxiliary area.
A series of nodes can be ungrouped so that the nodes in the series do not appear grouped together. Ungrouped series can likewise be regrouped.
选择也有助于理解高层次节点。选择任何高度节点,并选择相应的节点图标为它的其他连接。这使得它很容易,例如,看看哪些节点正在保存-哪些不是。
点击信息卡中的节点名将选择它。如果有必要,视点会自动平移,使节点可见。
最后,您可以选择两个配色方案为您的图形,使用颜色菜单上方的传说。默认结构视图显示结构:当两个高级节点具有相同的结构时,它们出现在相同颜色的彩虹中。唯一结构的节点是灰色的。有一个第二个视图,它显示了不同的操作。名称作用域按其内部操作的比例按比例着色。
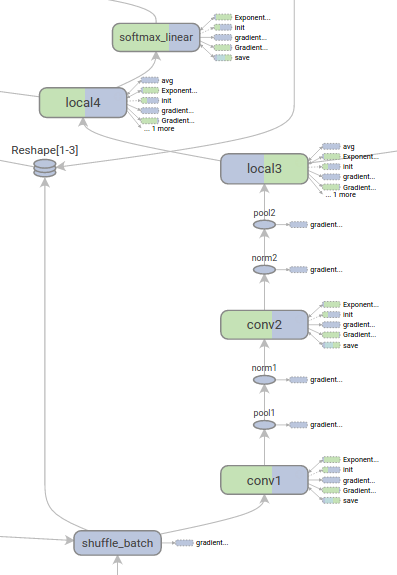
下面的图片给出了现实生活图的一个例子:
当序列化graphdef包括张量的形状,图形可视化标签边缘与张量尺寸和边缘厚度反映总张量的大小。包括在graphdef张量的形状通过实际图形对象(如成功。图)的输出序列化时图。下面的图像显示与张量形状信息的cifar-10模型:
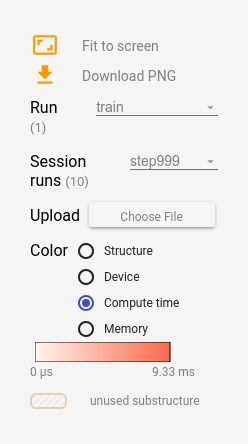
通常,收集运行时元数据是有用的,如总内存使用量、总计算时间和节点的张量形状。下面的代码示例是从火车和修改简单的MNIST教程试验段的一个片段,我们记录和运行统计总结。关于如何记录摘要,请参见摘要教程。Full
source is here.
此代码将产生运行时统计每第一百步开始在step99。
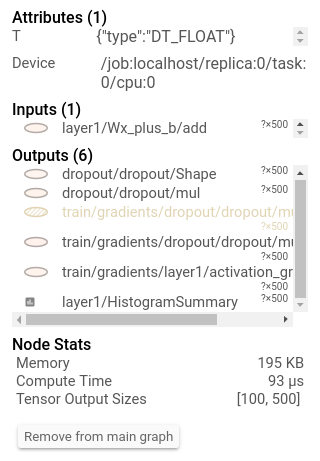
当你启动tensorboard去图”选项卡,你会看到选项下的“会话”对应的步骤运行元数据添加。选择其中一个运行将显示您在该步骤中的网络的快照,淡出未使用的节点。在左侧的控件中,您将能够通过总内存或总计算时间对节点进行着色。此外,点击一个节点将显示确切的总内存,计算时间和张量输出大小。
Visualization
of a TensorFlow graph.
看看自己的图,运行tensorboard指向它的工作日志目录,点击图”选项卡在顶部窗格中,在左上角用菜单选择合适的运行。在深度信息如何运行tensorboard确保你记录所有必要的信息,看see TensorBoard:
Visualizing Learning.。
Name scoping and nodes
典型的tensorflow图可以有多个节点,很容易看到一下子太多,甚至制定使用标准的图形工具。为了简化,变量名可以范围和可视化使用此信息来对图中的节点定义一个层次。默认情况下,只有该层次结构的顶部显示。这里有一个例子,在hidde层定义了三种业务范围使用tf.name_scope下的名字:import tensorflow as tf
with tf.name_scope('hidden') as scope:
a = tf.constant(5, name='alpha')
W = tf.Variable(tf.random_uniform([1, 2], -1.0, 1.0), name='weights')
b = tf.Variable(tf.zeros([1]), name='biases')This results in the following three op names:
hidden/alpha
hidden/weights
hidden/biases
默认情况下,可视化将将所有三个节点标记为隐藏的节点。额外的细节不会丢失。你可以双击或点击扩展节点的右上方的橙色+符号,然后你会看到三个子节点,alpha,weights,and bias.
这里是一个现实的例子,一个更复杂的节点在其初始和扩展状态。
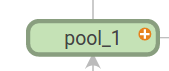 | 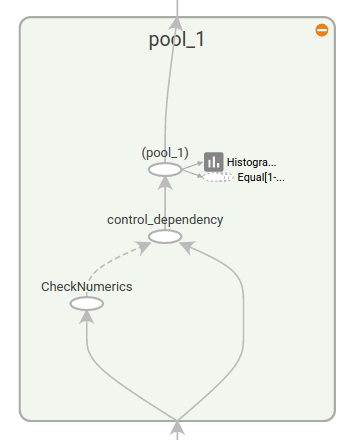 |
Initial view of top-level name scope pool_1. Clicking on the orange +button on the top right or double-clicking on the node itself will expand it. | Expanded view of pool_1name scope. Clicking on the orange -button on the top right or double-clicking on the node itself will collapse the name scope. |
上面的图说明了可视化的第二个方面。tensorflow图有两种连接方式:数据依赖和控制依赖关系。数据依赖关系显示两个OPS之间的张量流,并显示为实心箭头,而控件依赖性使用虚线。在扩展视图(右上图)所有的连接都是数据依赖,除了用虚线连接的checknumerics和control_dependency。
还有第二个技巧来简化布局。大多数tensorflow图几个节点都会与其他节点相连接。例如,许多节点可能对初始化步骤具有控制依赖性。绘制init节点及其依赖项之间的所有边缘将创建一个非常杂乱的视图。
为了减少杂波,可视化分离出所有的高度节点右侧的辅助区域,不画线来表示其边缘。我们画小节点图标,以指示连接。分离出辅助节点通常不会删除关键信息,因为这些节点通常与记账功能有关。查看如何在主图和辅助区域之间移动节点的交互。
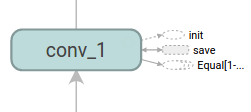 | 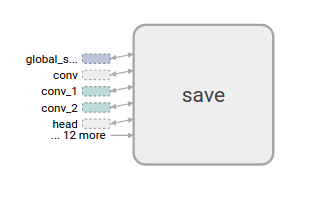 |
Node conv_1is connected to save. Note the little savenode icon on its right. | savehas a high degree, and will appear as an auxiliary node. The connection with conv_1is shown as a node icon on its left. To further reduce clutter, since savehas a lot of connections, we show the first 5 and abbreviate the others as ... 12 more. |
 |  |
| A collapsed view of a node sequence. | A small piece of the expanded view, after double-click. |
| Symbol | Meaning |
|---|---|
 | High-level node representing a name scope. Double-click to expand a high-level node. |
 | Sequence of numbered nodes that are not connected to each other. |
 | Sequence of numbered nodes that are connected to each other. |
 | An individual operation node. |
 | A constant. |
 | A summary node. |
 | Edge showing the data flow between operations. |
 | Edge showing the control dependency between operations. |
 | A reference edge showing that the outgoing operation node can mutate the incoming tensor. |
Interaction
通过平移和缩放导航图形。单击并拖动到泛,并使用滚动手势缩放。双击某个节点,或单击其“+”按钮,展开表示一组操作的名称范围。很容易地跟踪当前的观点时,缩放和平移,在右下角的小地图。要关闭打开的节点,请双击它或单击它的按钮。您也可以单击一次选择一个节点。它会变成一个更暗的颜色,它和它连接的节点的细节将出现在信息卡的右上角的可视化。
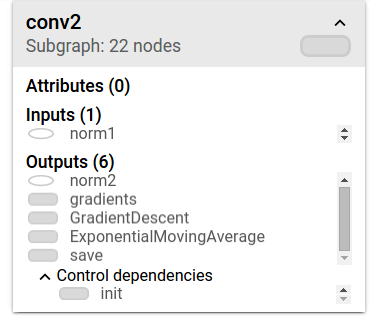 | 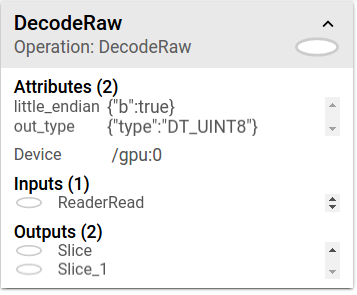 |
Info card showing detailed information for the conv2name scope. The inputs and outputs are combined from the inputs and outputs of the operation nodes inside the name scope. For name scopes no attributes are shown. | Info card showing detailed information for the DecodeRawoperation node. In addition to inputs and outputs, the card shows the device and the attributes associated with the current operation. |
Nodes can be moved between the main graph and the auxiliary area.
A series of nodes can be ungrouped so that the nodes in the series do not appear grouped together. Ungrouped series can likewise be regrouped.
选择也有助于理解高层次节点。选择任何高度节点,并选择相应的节点图标为它的其他连接。这使得它很容易,例如,看看哪些节点正在保存-哪些不是。
点击信息卡中的节点名将选择它。如果有必要,视点会自动平移,使节点可见。
最后,您可以选择两个配色方案为您的图形,使用颜色菜单上方的传说。默认结构视图显示结构:当两个高级节点具有相同的结构时,它们出现在相同颜色的彩虹中。唯一结构的节点是灰色的。有一个第二个视图,它显示了不同的操作。名称作用域按其内部操作的比例按比例着色。
下面的图片给出了现实生活图的一个例子:
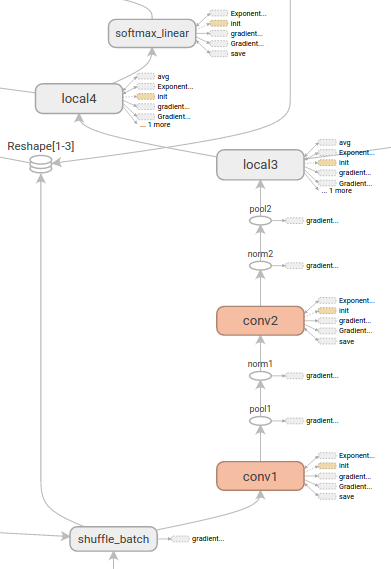 |  |
Structure view: The gray nodes have unique structure. The orange conv1and conv2nodes have the same structure, and analogously for nodes with other colors. | Device view: Name scopes are colored proportionally to the fraction of devices of the operation nodes inside them. Here, purple means GPU and the green is CPU. |
Tensor shape information
当序列化graphdef包括张量的形状,图形可视化标签边缘与张量尺寸和边缘厚度反映总张量的大小。包括在graphdef张量的形状通过实际图形对象(如成功。图)的输出序列化时图。下面的图像显示与张量形状信息的cifar-10模型: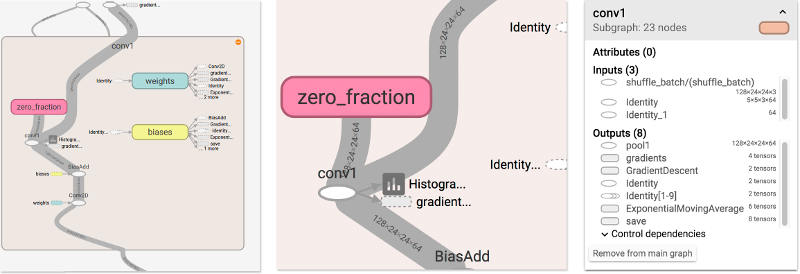 |
| CIFAR-10 model with tensor shape information. |
Runtime statistics
通常,收集运行时元数据是有用的,如总内存使用量、总计算时间和节点的张量形状。下面的代码示例是从火车和修改简单的MNIST教程试验段的一个片段,我们记录和运行统计总结。关于如何记录摘要,请参见摘要教程。Fullsource is here.
# Train the model, and also write summaries.
  # Every 10th step, measure test-set accuracy, and write test summaries
  # All other steps, run train_step on training data, & add training summaries

  def feed_dict(train):
    """Make a TensorFlow feed_dict: maps data onto Tensor placeholders."""
    if train or FLAGS.fake_data:
      xs, ys = mnist.train.next_batch(100, fake_data=FLAGS.fake_data)
      k = FLAGS.dropout
    else:
      xs, ys = mnist.test.images, mnist.test.labels
      k = 1.0
    return {x: xs, y_: ys, keep_prob: k}

  for i in range(FLAGS.max_steps):
    if i % 10 == 0:  # Record summaries and test-set accuracy
      summary, acc = sess.run([merged, accuracy], feed_dict=feed_dict(False))
      test_writer.add_summary(summary, i)
      print('Accuracy at step %s: %s' % (i, acc))
    else:  # Record train set summaries, and train
      if i % 100 == 99:  # Record execution stats
        run_options = tf.RunOptions(trace_level=tf.RunOptions.FULL_TRACE)
        run_metadata = tf.RunMetadata()
        summary, _ = sess.run([merged, train_step],
                              feed_dict=feed_dict(True),
                              options=run_options,
                              run_metadata=run_metadata)
        train_writer.add_run_metadata(run_metadata, 'step%d' % i)
        train_writer.add_summary(summary, i)
        print('Adding run metadata for', i)
      else:  # Record a summary
        summary, _ = sess.run([merged, train_step], feed_dict=feed_dict(True))
        train_writer.add_summary(summary, i)
此代码将产生运行时统计每第一百步开始在step99。
当你启动tensorboard去图”选项卡,你会看到选项下的“会话”对应的步骤运行元数据添加。选择其中一个运行将显示您在该步骤中的网络的快照,淡出未使用的节点。在左侧的控件中,您将能够通过总内存或总计算时间对节点进行着色。此外,点击一个节点将显示确切的总内存,计算时间和张量输出大小。

相关文章推荐
- Tensorflow实战学习(七)【Tensor、Graph、Op、Variable、占位符、Session、名称作用域、Board综合例子】
- TensorFlow官方文档TensorBoard: 图表可视化
- 深度学习框架TensorFlow 官方文档中文版
- TensorFlow学习笔记----TensorBoard_2
- Tensorflow学习:Tensorboard可视化(二)
- TensorFlow学习笔记(十二)TensorFLow tensorBoard 总结
- tensorflow学习笔记十7:tensorflow官方文档学习 How to Retrain Inception's Final Layer for New Categories
- Tensorflow学习笔记2:About Session, Graph, Operation and Tensor
- [TensorFlow]理解Tensorboard Graph
- [TensorFlow]入门学习笔记(6)-Tensorboard简易教程和模型保存
- Wiki 人工智能 深度学习 TensorFlow 官方文档中文版
- Tensorboard学习——mnist_with_summaries.py ---- TensorFlow可视化
- tensorflow学习笔记十五:tensorflow官方文档学习 TensorBoard: Embedding Visualization
- Tensorflow学习笔记2:About Session, Graph, Operation and Tensor
- 学习TensorFlow,TensorBoard可视化网络结构和参数
- TensorFlow学习笔记----TensorBoard_1
- tensorflow学习笔记十六:tensorflow官方文档学习 Mandelbrot Set
- tensorflow学习笔记十六:tensorflow官方文档学习 Image Recognition(Inception v3模型)
- tensorflow学习笔记十七:tensorflow官方文档学习 Convolutional Neural Networks
- 用tensorflow1.2.1版本调试出了一个小实例并用tensorboard查看graph以及summary