图像特征检测方法—SIFT的Python实现
2016-12-29 17:24
771 查看
这里介绍了图像特征检测算法-SIFT的Python实现,并且介绍了如何在一组图像中利用SIFT算法连接相互匹配的图像。
(2)SIFT算法详解
代码如下所示:
效果如下所示:
安装时,需要先安装graphviz-2.38.msi,再运行命令pip install pydot,最后可在系统路径PATH中添加graphviz的路径:C:\Program Files (x86)\Graphviz2.38\bin。注意:pydot的Node节点添加图片时,图片的路径需要为绝对路径,且分隔符为/。
1 参考资料
(1)Python计算机视觉编程(2)SIFT算法详解
2 描述子实现代码
这里使用开源工具包VLFeat提供的二进制文件来计算图像的SIFT特征。用完整的Python实现SIFT特征的所有步骤可能效率不是很高。VLFeat工具包可以从http://www.vlfeat.org/下载,二进制文件可以在所有主要的平台上运行。VLFeat库是用C语言来写的,但是我们可以使用该库提供的命令行接口。以在Windows 10 64bit平台上为例,下载的文件为vlfeat-0.9.20-bin.tar.gz,解压缩后,将vlfeat-0.9.20/bin/win64文件夹下的sift.exe和vl.dll拷贝到当前工作目录下。代码如下所示:
# -*- coding: utf-8 -*-
from PIL import Image
from pylab import *
from numpy import *
import os
def process_image(imagename, resultname, params="--edge-thresh 10 --peak-thresh 5"):
""" 处理一幅图像,然后将结果保存在文件中"""
if imagename[-3:] != 'pgm':
#创建一个pgm文件
im = Image.open(imagename).convert('L')
im.save('tmp.pgm')
imagename ='tmp.pgm'
cmmd = str("sift "+imagename+" --output="+resultname+" "+params)
os.system(cmmd)
print 'processed', imagename, 'to', resultname
def read_features_from_file(filename):
"""读取特征属性值,然后将其以矩阵的形式返回"""
f = loadtxt(filename)
return f[:,:4], f[:,4:] #特征位置,描述子
def write_featrues_to_file(filename, locs, desc):
"""将特征位置和描述子保存到文件中"""
savetxt(filename, hstack((locs,desc)))
def plot_features(im, locs, circle=False):
"""显示带有特征的图像
输入:im(数组图像),locs(每个特征的行、列、尺度和朝向)"""
def draw_circle(c,r):
t = arange(0,1.01,.01)*2*pi
x = r*cos(t) + c[0]
y = r*sin(t) + c[1]
plot(x, y, 'b', linewidth=2)
imshow(im)
if circle:
for p in locs:
draw_circle(p[:2], p[2])
else:
plot(locs[:,0], locs[:,1], 'ob')
axis('off')
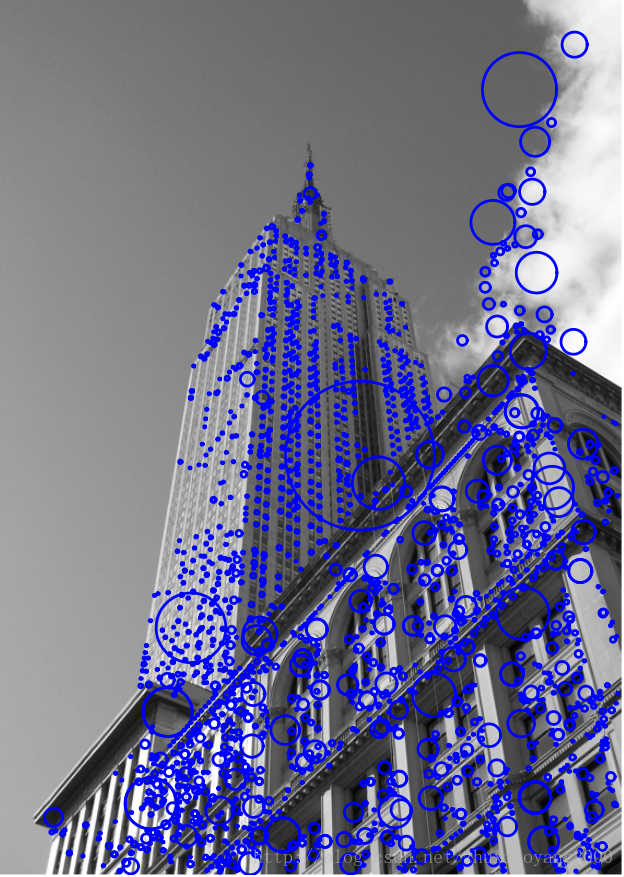
imname = 'empire.jpg'
im1 = array(Image.open(imname).convert('L'))
process_image(imname, 'empire.sift')
l1,d1 = read_features_from_file('empire.sift')
figure()
gray()
plot_features(im1, l1, circle=True)
show()效果如下所示:
3 匹配描述子实现代码
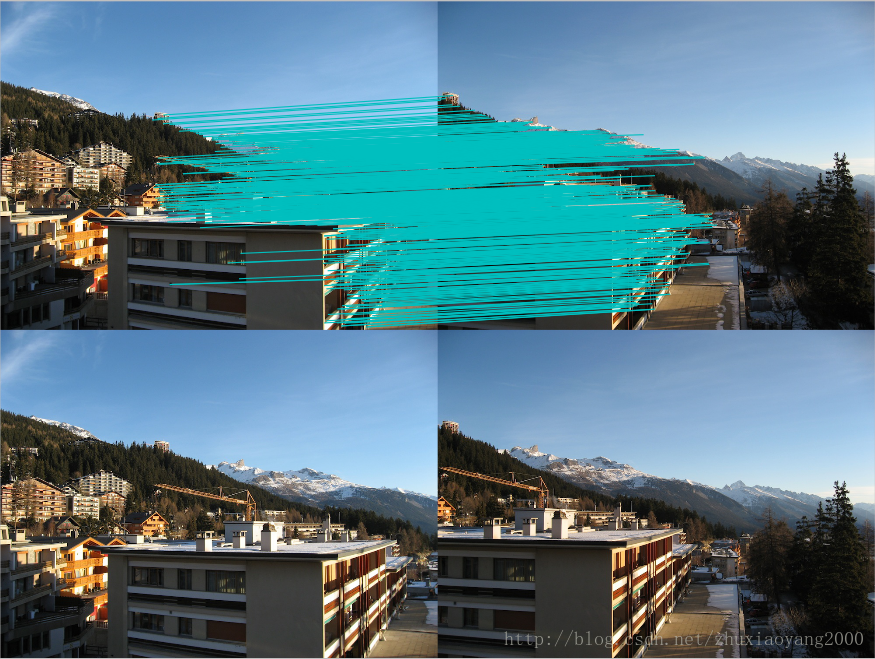
对于将一幅图像中的特征匹配到另一幅图像的特征,一种稳健的准则是使用这两个特征距离和两个最匹配特征距离的比率。相比于图像中的其他特征,该准则保证能够找到足够相似的唯一特征。使用该方法可以使错误的匹配数降低。# -*- coding: utf-8 -*-
from PIL import Image
from pylab import *
from numpy import *
import os
def process_image(imagename, resultname, params="--edge-thresh 10 --peak-thresh 5"):
""" 处理一幅图像,然后将结果保存在文件中"""
if imagename[-3:] != 'pgm':
#创建一个pgm文件
im = Image.open(imagename).convert('L')
im.save('tmp.pgm')
imagename ='tmp.pgm'
cmmd = str("sift "+imagename+" --output="+resultname+" "+params)
os.system(cmmd)
print 'processed', imagename, 'to', resultname
def read_features_from_file(filename):
"""读取特征属性值,然后将其以矩阵的形式返回"""
f = loadtxt(filename)
return f[:,:4], f[:,4:] #特征位置,描述子
def write_featrues_to_file(filename, locs, desc):
"""将特征位置和描述子保存到文件中"""
savetxt(filename, hstack((locs,desc)))
def plot_features(im, locs, circle=False):
"""显示带有特征的图像
输入:im(数组图像),locs(每个特征的行、列、尺度和朝向)"""
def draw_circle(c,r):
t = arange(0,1.01,.01)*2*pi
x = r*cos(t) + c[0]
y = r*sin(t) + c[1]
plot(x, y, 'b', linewidth=2)
imshow(im)
if circle:
for p in locs:
draw_circle(p[:2], p[2])
else:
plot(locs[:,0], locs[:,1], 'ob')
axis('off')
def match(desc1, desc2):
"""对于第一幅图像中的每个描述子,选取其在第二幅图像中的匹配
输入:desc1(第一幅图像中的描述子),desc2(第二幅图像中的描述子)"""
desc1 = array([d/linalg.norm(d) for d in desc1])
desc2 = array([d/linalg.norm(d) for d in desc2])
dist_ratio = 0.6
desc1_size = desc1.shape
matchscores = zeros((desc1_size[0],1),'int')
desc2t = desc2.T #预先计算矩阵转置
for i in range(desc1_size[0]):
dotprods = dot(desc1[i,:],desc2t) #向量点乘
dotprods = 0.9999*dotprods
# 反余弦和反排序,返回第二幅图像中特征的索引
indx = argsort(arccos(dotprods))
#检查最近邻的角度是否小于dist_ratio乘以第二近邻的角度
if arccos(dotprods)[indx[0]] < dist_ratio * arccos(dotprods)[indx[1]]:
matchscores[i] = int(indx[0])
return matchscores
def match_twosided(desc1, desc2):
"""双向对称版本的match()"""
matches_12 = match(desc1, desc2)
matches_21 = match(desc2, desc1)
ndx_12 = matches_12.nonzero()[0]
# 去除不对称的匹配
for n in ndx_12:
if matches_21[int(matches_12
)] != n:
matches_12
= 0
return matches_12
def appendimages(im1, im2):
"""返回将两幅图像并排拼接成的一幅新图像"""
#选取具有最少行数的图像,然后填充足够的空行
rows1 = im1.shape[0]
rows2 = im2.shape[0]
if rows1 < rows2:
im1 = concatenate((im1, zeros((rows2-rows1,im1.shape[1]))),axis=0)
elif rows1 >rows2:
im2 = concatenate((im2, zeros((rows1-rows2,im2.shape[1]))),axis=0)
return concatenate((im1,im2), axis=1)
def plot_matches(im1,im2,locs1,locs2,matchscores,show_below=True):
""" 显示一幅带有连接匹配之间连线的图片
输入:im1, im2(数组图像), locs1,locs2(特征位置),matchscores(match()的输出),
show_below(如果图像应该显示在匹配的下方)
"""
im3=appendimages(im1,im2)
if show_below:
im3=vstack((im3,im3))
imshow(im3)
cols1 = im1.shape[1]
for i in range(len(matchscores)):
if matchscores[i]>0:
plot([locs1[i,0],locs2[matchscores[i,0],0]+cols1], [locs1[i,1],locs2[matchscores[i,0],1]],'c')
axis('off')
# 示例
im1f = './data/crans_1_small.jpg'
im2f = './data/crans_2_small.jpg'
im1 = array(Image.open(im1f))
im2 = array(Image.open(im2f))
process_image(im1f, 'out_sift_1.txt')
l1,d1 = read_features_from_file('out_sift_1.txt')
figure()
gray()
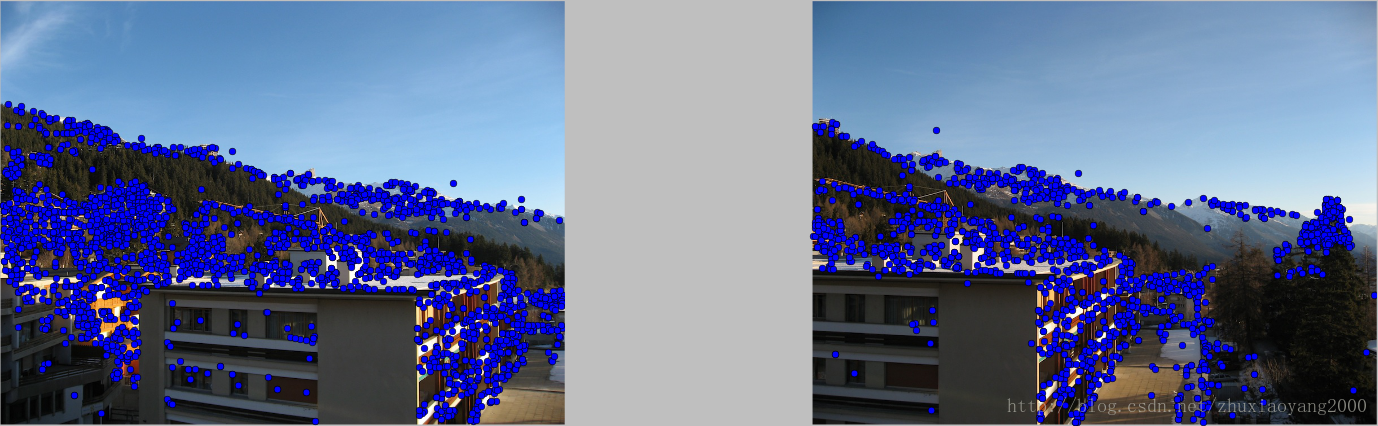
subplot(121)
plot_features(im1, l1, circle=False)
process_image(im2f, 'out_sift_2.txt')
l2,d2 = read_features_from_file('out_sift_2.txt')
subplot(122)
plot_features(im2, l2, circle=False)
matches = match_twosided(d1, d2)
print '{} matches'.format(len(matches.nonzero()[0]))
figure()
gray()
plot_matches(im1,im2,l1,l2,matches, show_below=True)
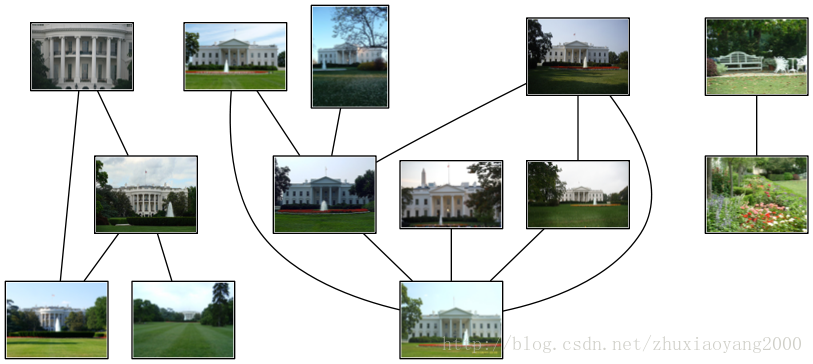
show()4 可视化连接图像
首先通过图像间是否具有匹配的局部描述子来定义图像间的连接,然后可视化这些连接情况。为了完成可视化,可以在图中显示这些图像,图的边代表连接。这里使用pydot工具包,该工具包是功能强大的GraphViz图形库的Python接口。安装时,需要先安装graphviz-2.38.msi,再运行命令pip install pydot,最后可在系统路径PATH中添加graphviz的路径:C:\Program Files (x86)\Graphviz2.38\bin。注意:pydot的Node节点添加图片时,图片的路径需要为绝对路径,且分隔符为/。
# -*- coding: utf-8 -*-
from PIL import Image
from pylab import *
from numpy import *
import os
import pydot
import sift

def get_imlist(path):
return [os.path.join(path,f) for f in os.listdir(path) if f.endswith('.jpg')]

# pydot需要绝对路径,路径分隔符为/而非\
download_path = "D:/Program/PythonTest/PythonTest/data/panoimages"
path = "D:/Program/PythonTest/PythonTest/data/panoimages/"

# list of downloaded filenames
imlist = get_imlist(download_path)
nbr_images = len(imlist)

# extract features
featlist = [imname[:-3] + 'sift' for imname in imlist]
for i, imname in enumerate(imlist):
sift.process_image(imname, featlist[i])

matchscores = zeros((nbr_images, nbr_images))

for i in range(nbr_images):
for j in range(i, nbr_images): #only compute upper triangle
print 'comparing ', imlist[i], imlist[j]
l1, d1 = sift.read_features_from_file(featlist[i])
l2, d2 = sift.read_features_from_file(featlist[j])
matches = sift.match_twosided(d1, d2)
nbr_matches = sum(matches>0)
print 'number of matches = ', nbr_matches
matchscores[i,j] = nbr_matches
print "The match scores is: \n", matchscores

# copy values
for i in range(nbr_images):
for j in range(i + 1, nbr_images): # no need to copy diagonal
matchscores[j, i] = matchscores[i, j]

# 可视化
threshold = 2 # min number of matches needed to craete link

g = pydot.Dot(graph_type='graph') # don't want the default directed graph

for i in range(nbr_images):
for j in range(i+1, nbr_images):
if matchscores[i,j] > threshold:
#图像对中的第一幅图像
im = Image.open(imlist[i])
im.thumbnail((100,100))
filename = path + str(i) + '.png'
im.save(filename) #需要一定大小的临时文件
g.add_node(pydot.Node(str(i), fontcolor='transparent',
shape='rectangle', image=filename))

#图像对中的第二幅图像
im = Image.open(imlist[j])
im.thumbnail((100,100))
filename = path + str(j) + '.png'
im.save(filename) #需要一定大小的临时文件
g.add_node(pydot.Node(str(j), fontcolor='transparent',
shape='rectangle', image=filename))
g.add_edge(pydot.Edge(str(i), str(j)))
g.write_png('whitehouse.png')

相关文章推荐
- Python图像特征检测算法(1):Python实现SIFT和Harris
- 图像特征检测描述(一):SIFT、SURF、ORB、HOG、LBP特征的原理概述及OpenCV代码实现
- python实现LBP方法提取图像纹理特征实现分类
- 基于C++和OpenCv的SIFT_图像局部特征检测算法代码的实现
- 【opencv】特征点检测方法--GFTT,SIFT,FAST,SURF
- VLFeat(1)——SIFT图像特征提取(VC++实现)
- 图像局部特征(五)--斑点检测之SIFT算法原理总结
- Python实现检测服务器是否可以ping通的2种方法
- 运用特征脸方法的基于Opencv的猫脸检测实现
- 图像处理中,SIFT,FAST,MSER,STAR等特征提取算法的比较与分析(利用openCV实现)
- VLFeat——SIFT图像特征提取(VC++实现)【转载】
- 人脸识别算法-特征脸方法(Eigenface)及python实现
- 用形态学的方法实现图像的角点检测
- 【图像处理入门】之图像的特征检测1:SIFT算法(未完待续)
- Python图像处理(13):brisk特征检测
- 四种比较简单的图像显著性区域特征提取方法原理及实现
- 飘逸的python - 使用图像匹配SIFT算法进行LOGO检测
- 【opencv】特征点检测方法--GFTT,SIFT,FAST,SURF
- python图像处理之反色实现方法
- 基于图像配准的图像特征检测之sift算法----sift算法总结