python替换缺失值,处理空值+生成图形+图形标准化
2016-12-13 15:09
447 查看
本例用到的库及方法有:json库读取json文件,pandas中value_counts计数,fillna替换缺失值,空字符串替换,counts的plot方法生成图形
plot(kind='barh',stacked=True)堆积条形图,normed_subset=count_subset.div(count_subset.sum(1),axis=0)条形规范化,总计为1
#文件格式为json,python内置json模块可以将json字符串转换成字典对象
import json
path='F:\workspace\python\pydata-book-master\ch02\usagov_bitly_data2012-03-16-1331923249.txt'
records=[json.loads(line) for line in open(path)]
#接下来用pandas中value_counts对时区进行计数
from pandas import DataFrame,Series
import pandas as pd;import numpy as np
frame=DataFrame(records)
frame
frame['tz'][:10]
tz_count=frame['tz'].value_counts()
tz_count[:10]
Out[12]:
America/New_York 1251
521
America/Chicago 400
America/Los_Angeles 382
America/Denver 191
Europe/London 74
Asia/Tokyo 37
Pacific/Honolulu 36
Europe/Madrid 35
America/Sao_Paulo 33
Name: tz, dtype: int64
##利用matplotlib生成一张图片
#先给缺失的时区填上一个替代值,fillna替换NA,空字符串用布尔型数组替换
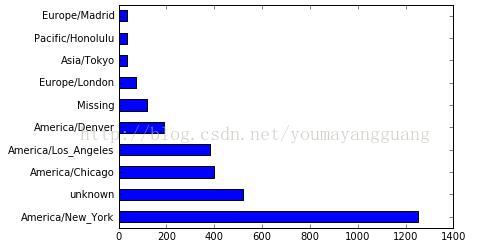
clean_tz=frame['tz'].fillna('Missing')
clean_tz[clean_tz=='']='unknown'
tz_counts=clean_tz.value_counts()
tz_counts[:10]
Out[16]: In [17]:
America/New_York 1251
unknown 521
America/Chicago 400
America/Los_Angeles 382
America/Denver 191
Missing 120
Europe/London 74
Asia/Tokyo 37
Pacific/Honolulu 36
Europe/Madrid 35
#利用counts的plot方法得到一张水平条形图
tz_counts[:10].plot(kind='barh',rot=0)
#找出windows用户,假定a字段中含有windows字样即为windows用户
frame.describe()
frame.head()
#split对字符串进行切片,Series是一种类似于一维数组的对象
results=Series([x.split()[0] for x in frame.a.dropna()])
results.head()
results.value_counts()[:8]
Out[21]:
0 Mozilla/5.0
1 GoogleMaps/RochesterNY
2 Mozilla/4.0
3 Mozilla/5.0
4 Mozilla/5.0
dtype: object
results.value_counts()[:8]
Out[22]:
Mozilla/5.0 2594
Mozilla/4.0 601
GoogleMaps/RochesterNY 121
Opera/9.80 34
TEST_INTERNET_AGENT 24
GoogleProducer 21
Mozilla/6.0 5
BlackBerry8520/5.0.0.681 4
dtype: int64
#找出windows用户
#将agent缺失的数据移除
cframe=frame[frame.a.notnull()]
operating_system=np.where(cframe['a'].str.contains('Windows'),'Windows','not Windows') #注意大小写
operating_system[:5]
#按时区对操作系统进行分组
by_tz_os=cframe.groupby(['tz',operating_system])
agg_counts=by_tz_os.size().unstack().fillna(0)
agg_counts[:10]
n [29]: count_subset=agg_counts.take(indexer)[-10:]
count_subset
Out[29]:
Windows not Windows
tz
America/Sao_Paulo 20 13
Europe/Madrid 19 16
Pacific/Honolulu 36 0
Asia/Tokyo 35 2
Europe/London 31 43
America/Denver 59 132
America/Los_Angeles 252 130
America/Chicago 285 115
276 245
America/New_York 912 339
#选取最常出现的时区
indexer=agg_counts.sum(1).argsort()
indexer[:10]
#通过take截取最后10行
count_subset=agg_counts.take(indexer)[-10:]
count_subset
#生成条形图,stacked=true生成堆积条形图
count_subset.plot(kind='barh',stacked=True)
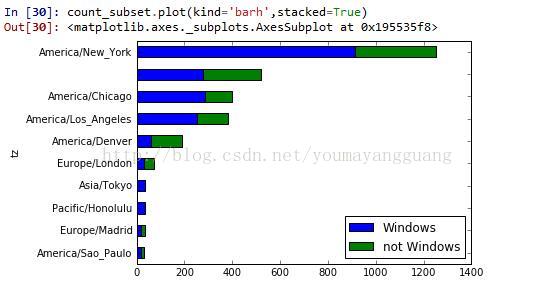
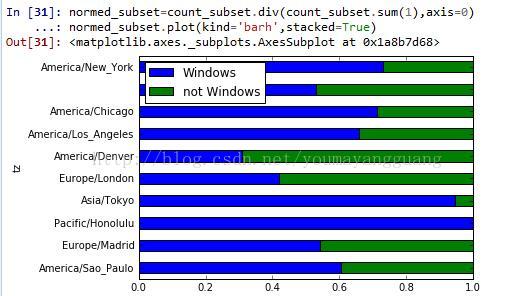
#上图不太容易区分较小分组中的windows用户,因此将各行规范化为‘总计为1’
normed_subset=count_subset.div(count_subset.sum(1),axis=0)
normed_subset.plot(kind='barh',stacked=True)
plot(kind='barh',stacked=True)堆积条形图,normed_subset=count_subset.div(count_subset.sum(1),axis=0)条形规范化,总计为1
#文件格式为json,python内置json模块可以将json字符串转换成字典对象
import json
path='F:\workspace\python\pydata-book-master\ch02\usagov_bitly_data2012-03-16-1331923249.txt'
records=[json.loads(line) for line in open(path)]
#接下来用pandas中value_counts对时区进行计数
from pandas import DataFrame,Series
import pandas as pd;import numpy as np
frame=DataFrame(records)
frame
frame['tz'][:10]
tz_count=frame['tz'].value_counts()
tz_count[:10]
Out[12]:
America/New_York 1251
521
America/Chicago 400
America/Los_Angeles 382
America/Denver 191
Europe/London 74
Asia/Tokyo 37
Pacific/Honolulu 36
Europe/Madrid 35
America/Sao_Paulo 33
Name: tz, dtype: int64
##利用matplotlib生成一张图片
#先给缺失的时区填上一个替代值,fillna替换NA,空字符串用布尔型数组替换
clean_tz=frame['tz'].fillna('Missing')
clean_tz[clean_tz=='']='unknown'
tz_counts=clean_tz.value_counts()
tz_counts[:10]
Out[16]: In [17]:
America/New_York 1251
unknown 521
America/Chicago 400
America/Los_Angeles 382
America/Denver 191
Missing 120
Europe/London 74
Asia/Tokyo 37
Pacific/Honolulu 36
Europe/Madrid 35
#利用counts的plot方法得到一张水平条形图
tz_counts[:10].plot(kind='barh',rot=0)
#找出windows用户,假定a字段中含有windows字样即为windows用户
frame.describe()
frame.head()
#split对字符串进行切片,Series是一种类似于一维数组的对象
results=Series([x.split()[0] for x in frame.a.dropna()])
results.head()
results.value_counts()[:8]
Out[21]:
0 Mozilla/5.0
1 GoogleMaps/RochesterNY
2 Mozilla/4.0
3 Mozilla/5.0
4 Mozilla/5.0
dtype: object
results.value_counts()[:8]
Out[22]:
Mozilla/5.0 2594
Mozilla/4.0 601
GoogleMaps/RochesterNY 121
Opera/9.80 34
TEST_INTERNET_AGENT 24
GoogleProducer 21
Mozilla/6.0 5
BlackBerry8520/5.0.0.681 4
dtype: int64
#找出windows用户
#将agent缺失的数据移除
cframe=frame[frame.a.notnull()]
operating_system=np.where(cframe['a'].str.contains('Windows'),'Windows','not Windows') #注意大小写
operating_system[:5]
#按时区对操作系统进行分组
by_tz_os=cframe.groupby(['tz',operating_system])
agg_counts=by_tz_os.size().unstack().fillna(0)
agg_counts[:10]
n [29]: count_subset=agg_counts.take(indexer)[-10:]
count_subset
Out[29]:
Windows not Windows
tz
America/Sao_Paulo 20 13
Europe/Madrid 19 16
Pacific/Honolulu 36 0
Asia/Tokyo 35 2
Europe/London 31 43
America/Denver 59 132
America/Los_Angeles 252 130
America/Chicago 285 115
276 245
America/New_York 912 339
#选取最常出现的时区
indexer=agg_counts.sum(1).argsort()
indexer[:10]
#通过take截取最后10行
count_subset=agg_counts.take(indexer)[-10:]
count_subset
#生成条形图,stacked=true生成堆积条形图
count_subset.plot(kind='barh',stacked=True)
#上图不太容易区分较小分组中的windows用户,因此将各行规范化为‘总计为1’
normed_subset=count_subset.div(count_subset.sum(1),axis=0)
normed_subset.plot(kind='barh',stacked=True)

相关文章推荐
- Python 对谷歌协议文件 .proto 文件的生成与处理 (python 命令、查找、替换)
- python图形处理库PIL(Python Image Library)的基本概念
- python进行文本处理生成redmine表格
- python图形处理库PIL(Python Image Library)的介绍
- 74.Oracle数据库SQL开发之 高级查询——处理空值和缺失值
- Python图像处理(1):替换OpenCV
- [tips]python图形处理库Python Imaging Library (PIL)简...
- ean13码的生成,python读取csv中数据并处理返回并写入到另一个csv文件中
- python图形处理库Python Imaging Library (PIL)简介及安装
- python处理文本文件实现生成指定格式文件的方法
- 安装python的图形处理库: pillow
- Python图形图像处理库的介绍之Image模块
- python处理文本文件实现生成指定格式文件的方法
- python处理文本文件,生成指定格式的文件
- Python图片处理PIL/pillow/生成验证码/出现KeyError: 和The _imagingft C module is not installed
- python结合Arcpy处理EXCEL数据生成多边形
- python对找到的匹配项作处理后再替换回去
- python处理文本文件实现生成指定格式文件的方法
- IText 生成pdf,处理table cell列跨页缺失的问题
- Python图形图像处理库的介绍之ImageChops模块.