mysql查询语句优化工具
2016-11-21 14:23
417 查看
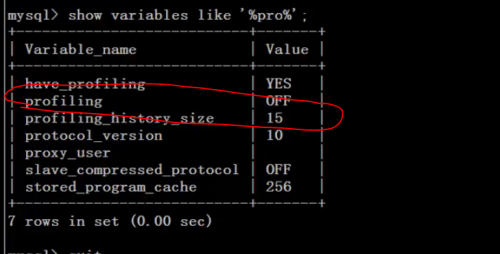
把这个profiling功能打开,可以查看sql查询语句的整个过程中各种资源的消耗情况。
mysql> show profiles;
+----------+------------+---------------------------------+
| Query_ID | Duration | Query |
+----------+------------+---------------------------------+
| 1 | 0.00049600 | show variables like "profiling" |
| 2 | 0.02267400 | show databases |
| 3 | 0.04235200 | SELECT DATABASE() |
| 4 | 0.00012825 | SELECT DATABASE() |
| 5 | 0.00025125 | show databases |
| 6 | 0.00145125 | show tables |
| 7 | 0.04207925 | show tables |
| 8 | 0.03485225 | select count(*) from host_item |
+----------+------------+---------------------------------+
mysql> show profile cpu, block io for query 8;
+----------------------+----------+----------+------------+--------------+---------------+
| Status | Duration | CPU_user | CPU_system | Block_ops_in | Block_ops_out |
+----------------------+----------+----------+------------+--------------+---------------+
| starting | 0.000634 | 0.000000 | 0.000000 | 0 | 0 |
| checking permissions | 0.000013 | 0.000000 | 0.000000 | 0 | 0 |
| Opening tables | 0.000051 | 0.000000 | 0.000000 | 0 | 0 |
| System lock | 0.000014 | 0.000000 | 0.000000 | 0 | 0 |
| init | 0.000015 | 0.000000 | 0.000000 | 0 | 0 |
| optimizing | 0.033657 | 0.000000 | 0.000000 | 40 | 0 |
| statistics | 0.000029 | 0.000000 | 0.000000 | 0 | 0 |
| preparing | 0.000012 | 0.000000 | 0.000000 | 0 | 0 |
| executing | 0.000006 | 0.000000 | 0.000000 | 0 | 0 |
| Sending data | 0.000313 | 0.000000 | 0.000000 | 0 | 0 |
| end | 0.000008 | 0.000000 | 0.000000 | 0 | 0 |
| query end | 0.000008 | 0.000000 | 0.000000 | 0 | 0 |
| closing tables | 0.000047 | 0.000000 | 0.000000 | 0 | 0 |
| freeing items | 0.000042 | 0.000000 | 0.000000 | 0 | 0 |
| logging slow query | 0.000003 | 0.000000 | 0.000000 | 0 | 0 |
| cleaning up | 0.000003 | 0.000000 | 0.000000 | 0 | 0 |
+----------------------+----------+----------+------------+--------------+---------------
show profile后面可以跟参数:all或者cpu,block io,page faults等。
也可以在information_schema.profiling数据库表中直接查询:
select state,sum(duration) as total_r,round(100*sum(duration)/(select
sum(duration) from information_schema.profiling where
query_id=@query_id),2) as pct_r,count(*) as calls,sum(duration)/count(*)
as "r/call" from information_schema.profiling where query_id=@query_id
group by state order by total_r desc;
最后,关闭set profiling=0该功能。

相关文章推荐
- mysql查询语句优化命令mysql explain
- Mysql查询语句优化一则
- MySQL查询优化:连接查询排序limit(join、order by、limit语句)介绍
- MySQL查询优化:连接查询排序limit(join、order by、limit语句)
- Mysql 中优化 SQL 语句查询的30种方法
- Mysql API 查询优化 为什么要选用预处理语句( mysql_stmt_* )
- SQL SERVER查询优化工具:统计SQL语句执行时间
- mysql中优化sql语句查询的30种方法
- mysql查询语句优化
- MySQL优化查询语句Explain
- mysql 的优化(如何查询mysql中执行效率低的sql语句)
- MySQL中优化sql语句查询常用的30种方法
- 浅谈MySQL中优化sql语句查询常用的30种方法
- mysql limit查询语句优化原则
- mysql优化SELECT语句和其它查询
- mysql优化SELECT语句和其它查询
- Sql查询语句优化心得MySQL优化
- MySQL查询优化:连接查询排序limit(join、order by、limit语句)