Grafana + Zabbix --- 部署分布式监控系统
2016-11-04 16:02
941 查看
转自
http://www.cnblogs.com/yyhh/p/4792830.html
Zabbix的一个很优秀的分布式监控服务器, 它有两部分组成:
1. “zabbix-server”用来收集并且在web端展示数据
2. “zabbix-agent”用来采集数据,发送给server
在安装Zabbix时,用了3台虚拟机来测试监控的数据是否正常采集、展示:
Server:
ZabbixServer --- IP : 192.168.246.133
Client:
ZabbixClient_1 --- IP : 192.168.246.134
ZabbixClient_2 --- IP : 192.168.246.135
Linux的防火墙是咱们新手的噩梦,很多情况会出现能ping通,但是访问不了Web页面。所以开始就干掉它!
// 关闭防火墙
// 开机关闭防火墙
zabbix官方提供了下载源,直接执行下面命令,下载安装就可以了
http://www.cnblogs.com/yyhh/p/4792830.html
序章:
Zabbix的一个很优秀的分布式监控服务器, 它有两部分组成:1. “zabbix-server”用来收集并且在web端展示数据
2. “zabbix-agent”用来采集数据,发送给server
在安装Zabbix时,用了3台虚拟机来测试监控的数据是否正常采集、展示:
Server:
ZabbixServer --- IP : 192.168.246.133
Client:
ZabbixClient_1 --- IP : 192.168.246.134
ZabbixClient_2 --- IP : 192.168.246.135
1. 关闭防火墙
Linux的防火墙是咱们新手的噩梦,很多情况会出现能ping通,但是访问不了Web页面。所以开始就干掉它!// 关闭防火墙
[root@localhost ~]# /etc/init.d/iptables stop
iptables: Setting chains to policy ACCEPT: filter          [  OK  ]
iptables: Flushing firewall rules:                         [  OK  ]
iptables: Unloading modules:                               [  OK  ]
// 开机关闭防火墙
[root@localhost ~]# chkconfig iptables off
2. 安装Zabbix下载源
zabbix官方提供了下载源,直接执行下面命令,下载安装就可以了# rpm -ivh http://repo.zabbix.com/zabbix/2.4/rhel/6/x86_64/zabbix-release-2.4-1.el6.noarch.rpm[/code]
提示安装成功后,查看Linux下载源,是否正确安装,如果安装成功,Linux下会有zabbix.repo源文件
[root@localhost Desktop]# ll /etc/yum.repos.d/ total 28 -rw-r--r--. 1 root root 1991 Aug 4 00:13 CentOS-Base.repo -rw-r--r--. 1 root root 647 Aug 4 00:13 CentOS-Debuginfo.repo -rw-r--r--. 1 root root 289 Aug 4 00:13 CentOS-fasttrack.repo -rw-r--r--. 1 root root 630 Aug 4 00:13 CentOS-Media.repo -rw-r--r--. 1 root root 6259 Aug 4 00:13 CentOS-Vault.repo -rw-r--r--. 1 root root 401 Sep 11 2014 zabbix.repo
分别在ZabbixClient_1与ZabbixClient_2安装并配置如下设置:
3. ZabbixClient --- 安装zabbix-agent代理
关闭防火墙[root@localhost Desktop]# /etc/init.d/iptables stop [root@localhost Desktop]# chkconfig iptables off
安装Zabbix官方下载源[root@localhost Desktop]# rpm -ivh http://repo.zabbix.com/zabbix/2.4/rhel/6/x86_64/zabbix-release-2.4-1.el6.noarch.rpm[/code]
安装zabbix-agent,在下载的时候,会自动安装zabbix-agent的基础依赖包[root@localhost Desktop]# yum install zabbix-agent
进入zabbix-agent的Config文件[root@localhost Desktop]# vim /etc/zabbix/zabbix_agentd.conf
配置zabbix-agent的参数,主要修改Server的IP和Hostname,Server=192.168.246.133 Hostname=localhost
启动zabbix-agent[root@localhost Desktop]# /etc/init.d/zabbix-agent start
关闭防火墙
4. ZabbixServer --- 安装zabbix-server服务[root@localhost Desktop]# /etc/init.d/iptables stop [root@localhost Desktop]# chkconfig iptables off
安装Zabbix官方下载源[root@localhost Desktop]# rpm -ivh http://repo.zabbix.com/zabbix/2.4/rhel/6/x86_64/zabbix-release-2.4-1.el6.noarch.rpm[/code]
通过zabbix提供的下载源,下载并安装zabbix-server-mysql和zabbix-web-mysql,这个两个mysql数据库是用来存放采集到的数据,Zabbix的web端会通过这些数据,来展示绘图。而zabbix-get则是用来收集数据的指令。# yum install zabbix-server-mysql zabbix-web-mysql zabbix-get
在下载这两个包的时候,会提示你安装基础依赖包,其中这些基础包中,还有zabbix-server的服务端的包,选择“y”继续即可。
// 以下是需要安装的基础依赖包================================================================================ Package Arch Version Repository Size ================================================================================ Installing: zabbix-server-mysql x86_64 2.4.6-1.el6 zabbix 1.5 M zabbix-web-mysql noarch 2.4.6-1.el6 zabbix 14 k Installing for dependencies: OpenIPMI-libs x86_64 2.0.16-14.el6 base 473 k fping x86_64 2.4b2-16.el6 zabbix-non-supported 31 k iksemel x86_64 1.4-2.el6 zabbix-non-supported 47 k net-snmp x86_64 1:5.5-54.el6_7.1 updates 308 k php-bcmath x86_64 5.3.3-46.el6_6 updates 39 k php-mbstring x86_64 5.3.3-46.el6_6 updates 459 k php-mysql x86_64 5.3.3-46.el6_6 updates 86 k zabbix x86_64 2.4.6-1.el6 zabbix 161 k zabbix-server x86_64 2.4.6-1.el6 zabbix 22 k zabbix-web noarch 2.4.6-1.el6 zabbix 4.5 M Updating for dependencies: net-snmp-libs x86_64 1:5.5-54.el6_7.1 updates 1.5 M php x86_64 5.3.3-46.el6_6 updates 1.1 M php-cli x86_64 5.3.3-46.el6_6 updates 2.2 M php-common x86_64 5.3.3-46.el6_6 updates 529 k php-gd x86_64 5.3.3-46.el6_6 updates 111 k php-pdo x86_64 5.3.3-46.el6_6 updates 79 k php-xml x86_64 5.3.3-46.el6_6 updates 107 k Transaction Summary ================================================================================
启动mysql,我的CentOS在安装的时候,就把mysql的软件给安装了,如果没有mysql,则需要去安装mysql,我这里就直接启动mysql就可以了
5. ZabbixServer --- 配置zabbix-server的数据库# /etc/init.d/mysqld start
成功启动mysql的话,输入mysql,就可以进入mysql的命令行了。进入命令行,创建zabbix数据库[root@localhost ~]# mysql mysql> create database zabbix; Query OK, 1 row affected (0.00 sec)
在mysql中,查看刚刚创建的zabbix是否创建成功,如下图数据库中,有zabbix代表已经创建成功mysql> show databases; +--------------------+ | Database | +--------------------+ | information_schema | | mysql | | test | | zabbix | +--------------------+ 4 rows in set (0.00 sec)
接下要要执行zabbix官方提供是sql语句。在安装基础依赖包的时候,已经在文件里面了。现在可以直接执行[root@localhost ~]# cd /usr/share/doc/zabbix-server-mysql-2.4.6/create/ [root@localhost create]# mysql -uroot zabbix < schema.sql [root@localhost create]# mysql -uroot zabbix < images.sql [root@localhost create]# mysql -uroot zabbix < data.sql
配置在以下路径里面 :
6. ZabbixServer --- 配置zabbix-server的服务参数# vim /etc/zabbix/zabbix_server.conf
如果没有特殊需要的话,使用默认配置就可以了,我的mysql账户是root,所以需要修改DBuserLogFile=/var/log/zabbix/zabbix_server.log LogFileSize=0 PidFile=/var/run/zabbix/zabbix_server.pid DBName=zabbix DBUser=root DBSocket=/var/lib/mysql/mysql.sock StartPollers=5 CacheSize=256M SNMPTrapperFile=/var/log/snmptt/snmptt.log AlertScriptsPath=/usr/lib/zabbix/alertscripts ExternalScripts=/usr/lib/zabbix/externalscripts
修改zabbix的时区,有些系统并不是北京时间,如果是国外的时间,在展示出来的图的时间就是错的,为了保守起见,设置一下zabbix的时区# vim /etc/httpd/conf.d/zabbix.conf
修改以下字段php_value date.timezone Asia/Shanghai
修改zabbix的php的时区# vim /etc/php.ini
修改以下字段date.timezone = Asia/Shanghai
启动Zabbix服务,启动httpd:[root@localhost create]# /etc/init.d/zabbix-server start [root@localhost create]# /etc/init.d/httpd start
安装好了zabbix-agent和zabbix-server。在Server端试试能不能收到agent端的数据,可以使用zabbix-get。在安装mysql的时候,已经将zabbix-get安装过了。可以使用zabbix_get -help命令来查看该命令怎么使用
7. 使用zabbix-get[root@localhost create]# zabbix_get -help Zabbix get v2.4.6 (revision 54796) (10 August 2015) usage: zabbix_get [-hV] -s <host name or IP> [-p <port>] [-I <IP address>] -k <key> Options: -s --host <host name or IP> Specify host name or IP address of a host -p --port <port number> Specify port number of agent running on the host. Default is 10050 -I --source-address <IP address> Specify source IP address -k --key <key of metric> Specify key of item to retrieve value for -h --help Display help information -V --version Display version number Example: zabbix_get -s 127.0.0.1 -p 10050 -k "system.cpu.load[all,avg1]"
测试是否能收到数据,使用以下命令,发现是可以收到的。
// 测试是否可以收到系统的信息[root@localhost create]# zabbix_get -s 192.168.246.134 -p 10050 -k "system.uname" Linux localhost.localdomain 2.6.32-573.el6.x86_64 #1 SMP Thu Jul 23 15:44:03 UTC 2015 x86_64
// 测试是否可以收到CPU的数据[root@localhost create]# zabbix_get -s 192.168.246.134 -p 10050 -k "system.cpu.load" 0.020000
在Server端,启动Zabbix服务,启动httpd:
8. 登录Zabbix的Web端[root@localhost create]# /etc/init.d/zabbix-server start [root@localhost create]# /etc/init.d/httpd start
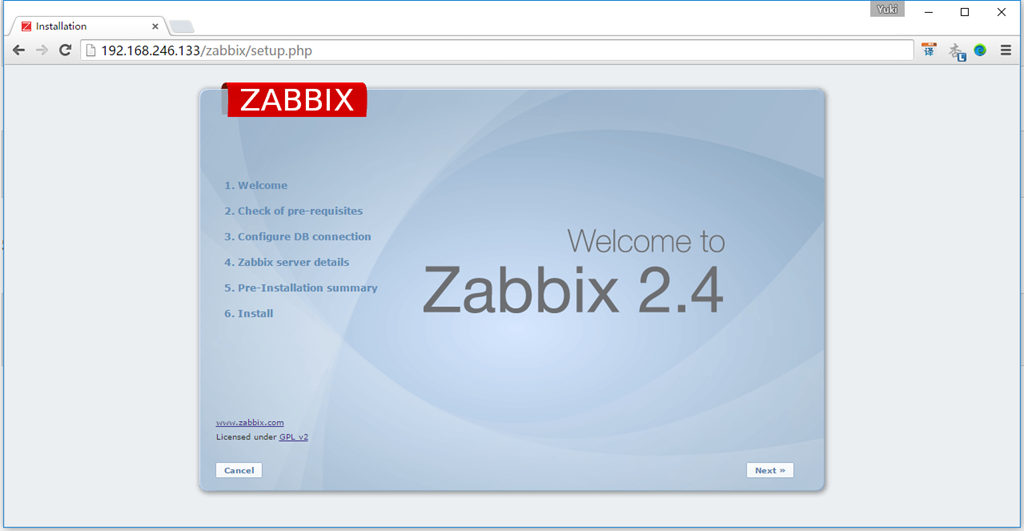
登录Zabbix的Web客户端,在浏览器中输入“http://192.168.246.133/zabbix/index.php”,默认会跳转至Zabbix的setup引导页面:
点击Next
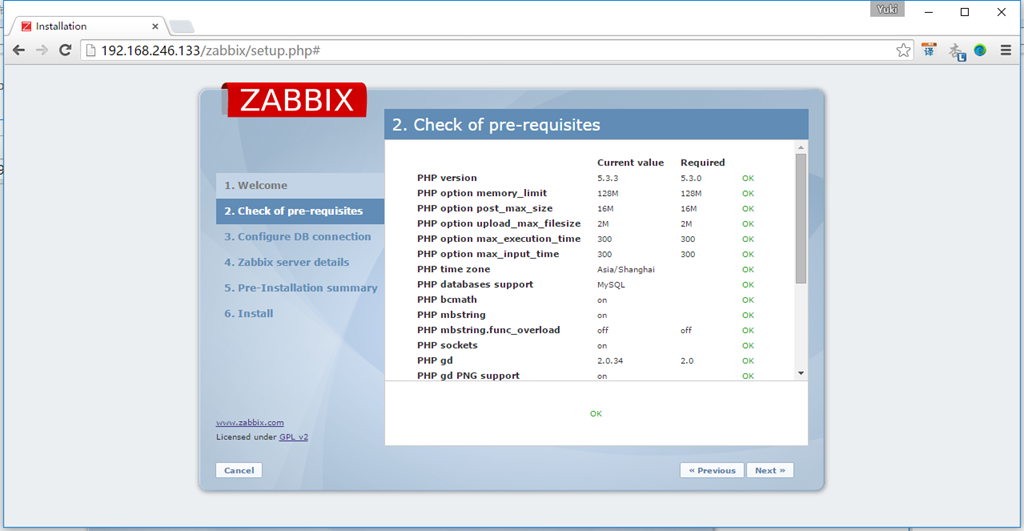
点击Next
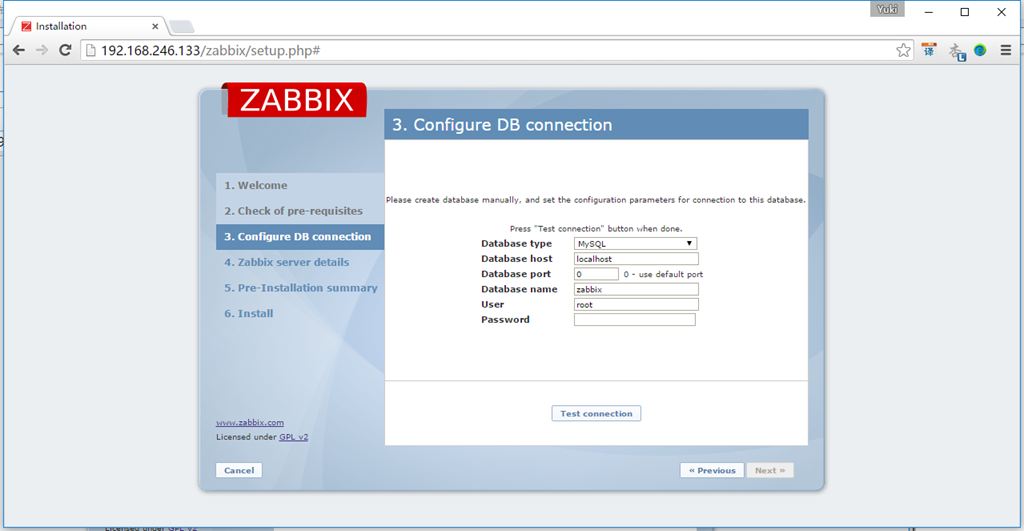
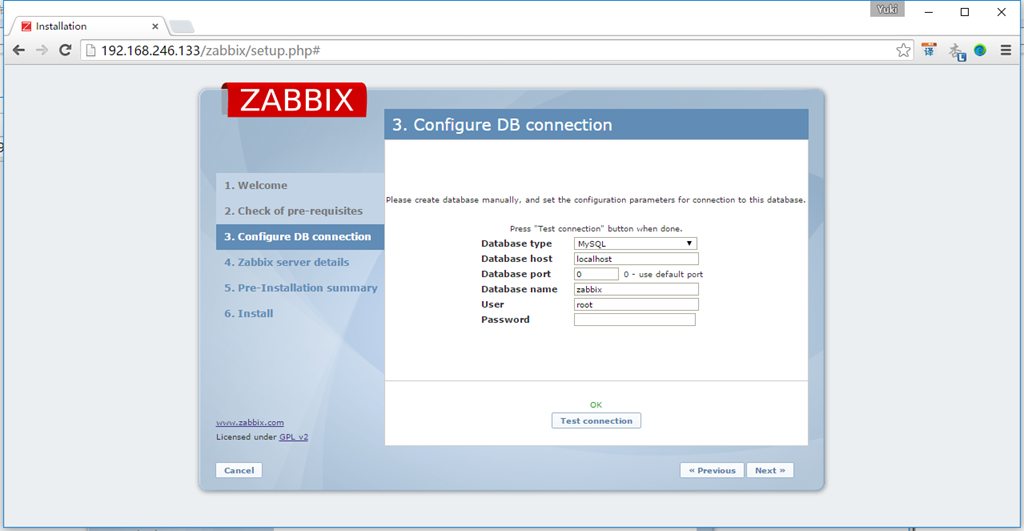
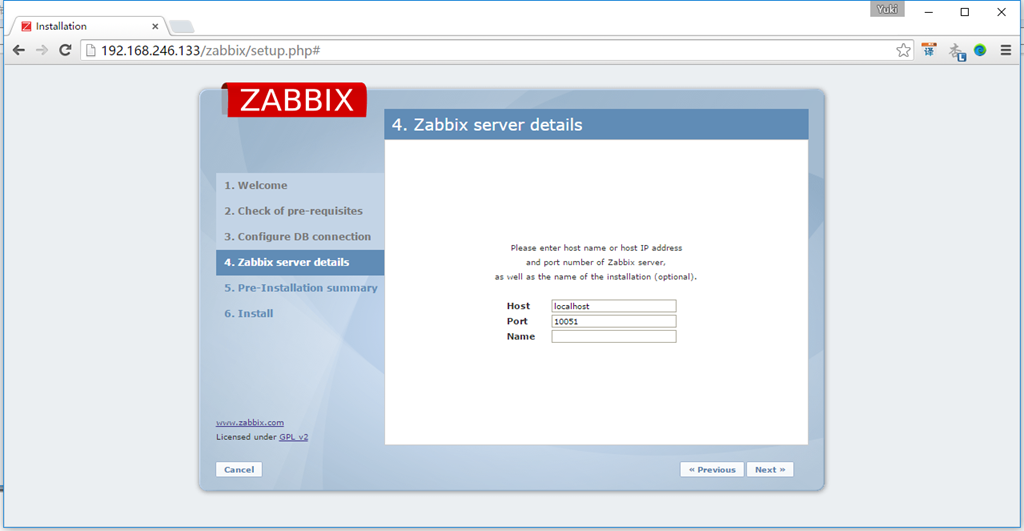
点击Test connection,否则无法点击Next, 测试连接成功后,点击Next
设置端口,可以直接使用默认设置的端口10051
点击Next
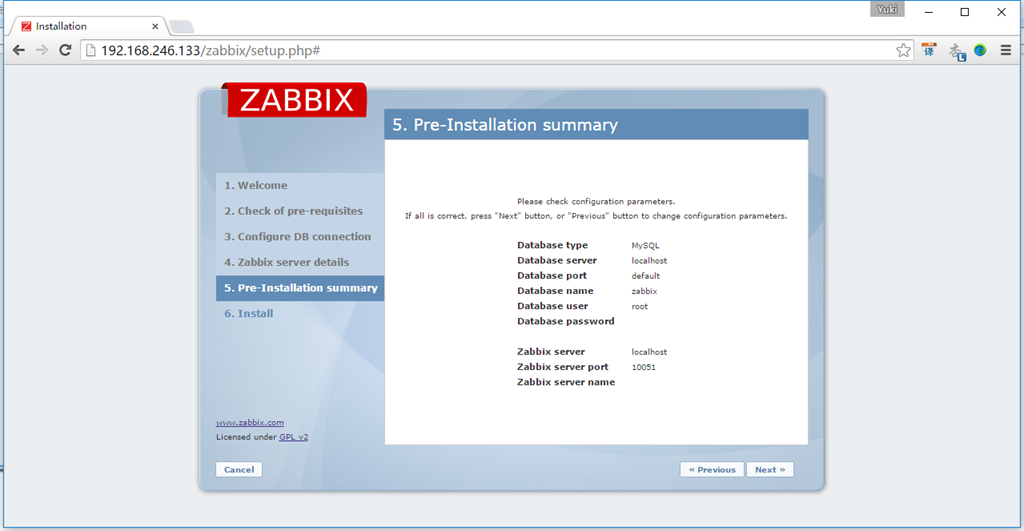
点击Next
点击Finish,完成初始化引导
输入默认的账号密码,账号:admin, 密码zabbix
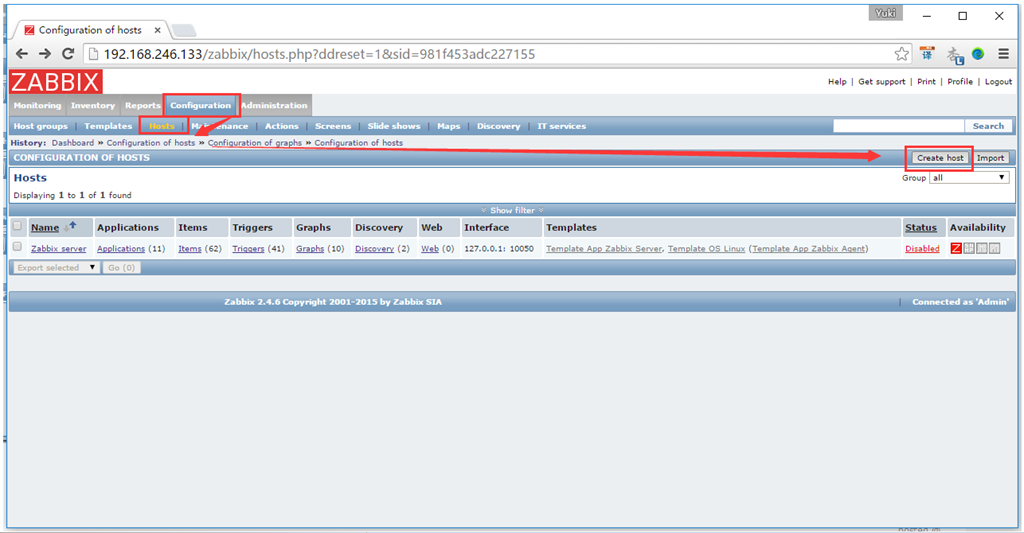
点击下图的Create host
9. 在Web配置zabbix监控agent
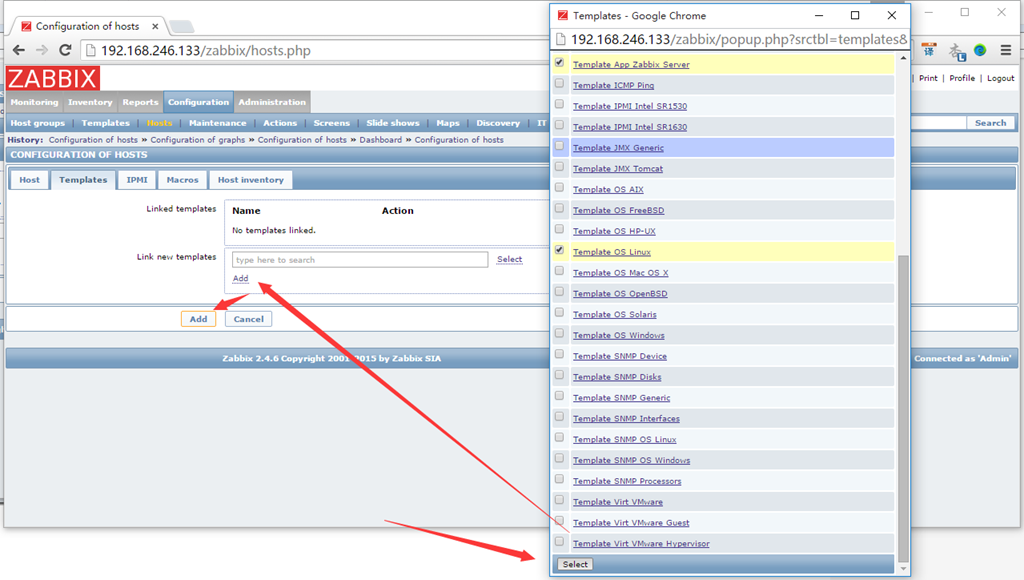
按下图配置,主意要输入agent的IP和端口,端口默认是10050
点击select,选择Linux OS和zabbix Server的模板,点击Select->Add->Add,如下图
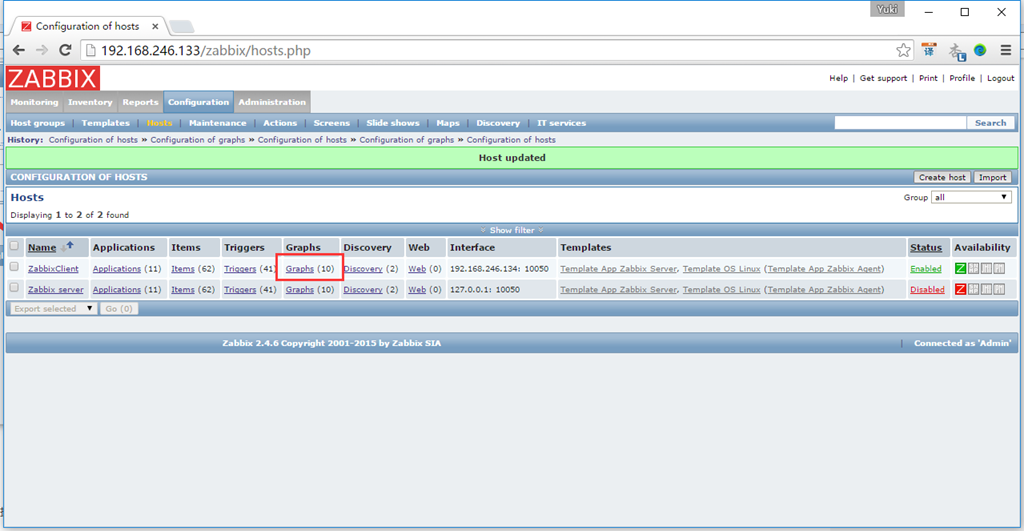
添加了以后就已经自动启动了,可以点击Graphs,查看是否有数据过来
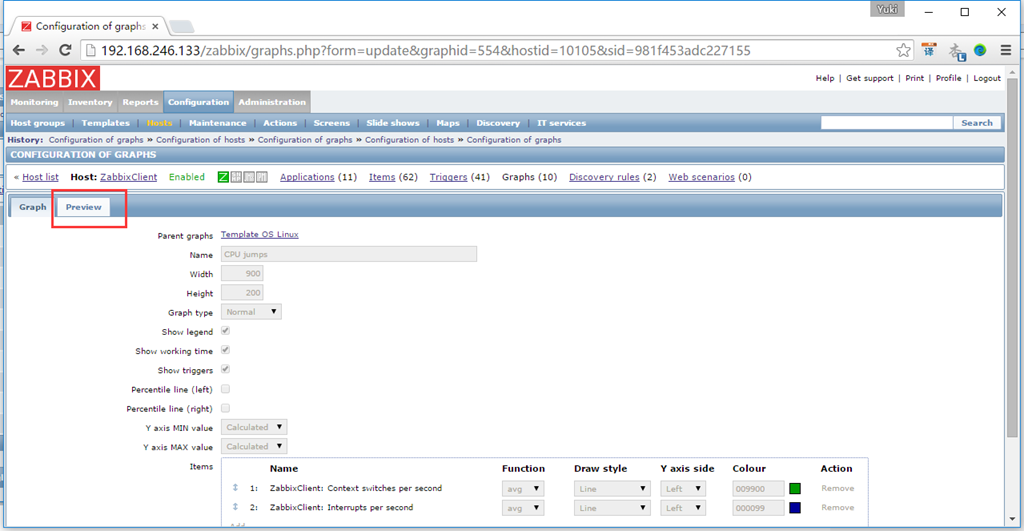
点击CPU jumps
点击preview
就可以看到agent那边有数据传过来了
在ZabbixServer服务器上,安装Grafana
10. 安装Grafanayum install https://grafanarel.s3.amazonaws.com/builds/grafana-2.1.1-1.x86_64.rpm[/code]
下载Grafana的Zabbix插件,在git上下载,如果无法运行下面命令的话,可以先“# yum install git”安装这个命令[root@localhost ~]# git clone https://github.com/linglong0820/grafana-zabbix[/code]
将插件复制到Grafana文件下[root@localhost ~]# cp -r grafana-zabbix/zabbix/ /usr/share/grafana/public/app/plugins/datasource/
启动Grafana[root@localhost ~]# service grafana-server start [root@localhost ~]# chkconfig grafana-server on
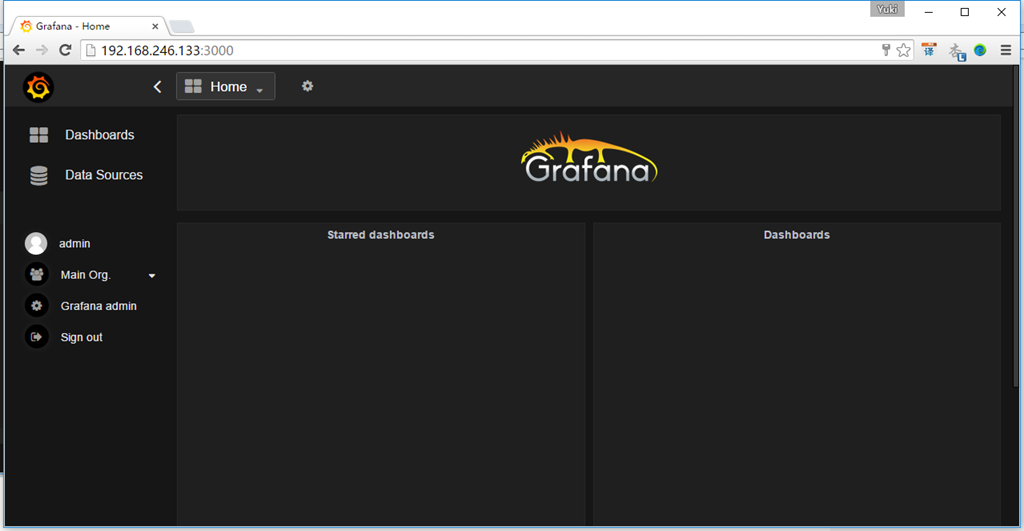
启动Grafana后,在浏览器中输入“http://192.168.246.133:3000/login”就可以看到页面了。
11. 登录Grafana并且配置
输入默认用户名和密码,用户名:admin, 密码:admin, 点击登录
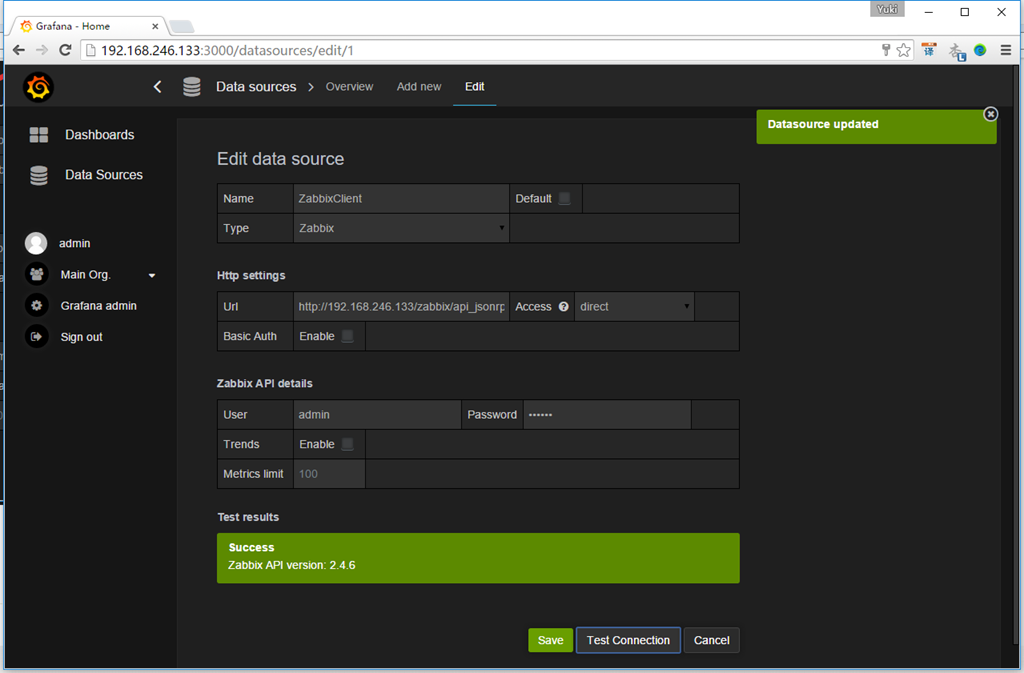
按如下配置
【主意1】Zabbix的API地址为“http://192.168.246.133/zabbix/api_jsonrpc.php”,其中IP的安装zabbix-server的服务器IP
【主意2】Zabbix的API账号密码就是Zabbix的Web端登录账号和密码,账号:admin, 密码zabbix
点击Add后,点击Test Connection测试是否可以连接。提示“Success”说明连接成功,点击Save
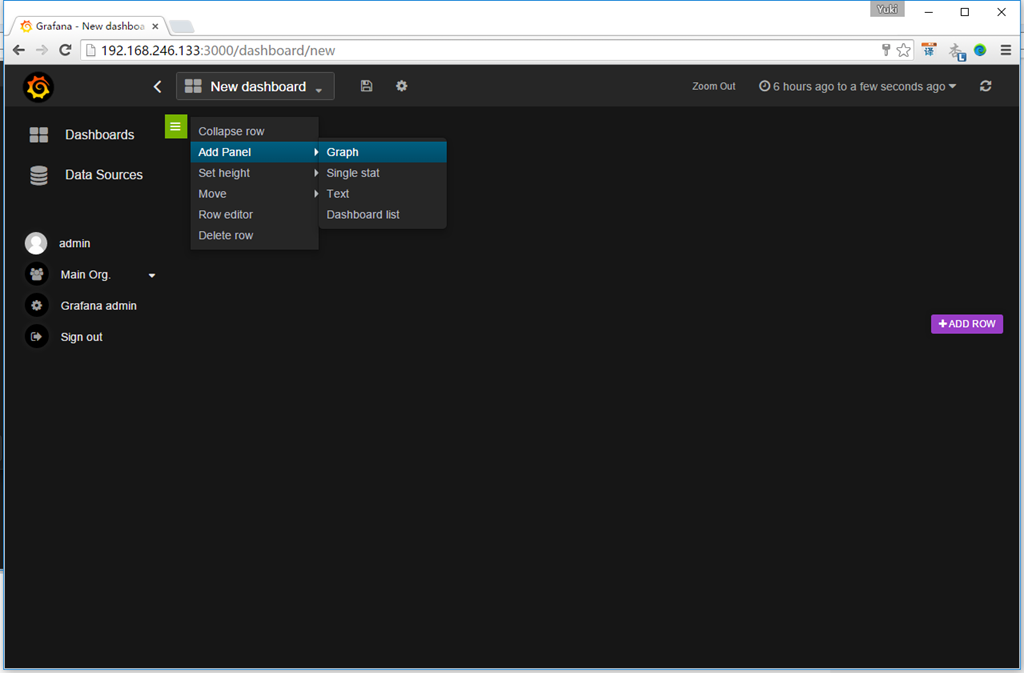
点击Dashboard,去主目录设置, 点击new,新建一个Home
新建一个Graph
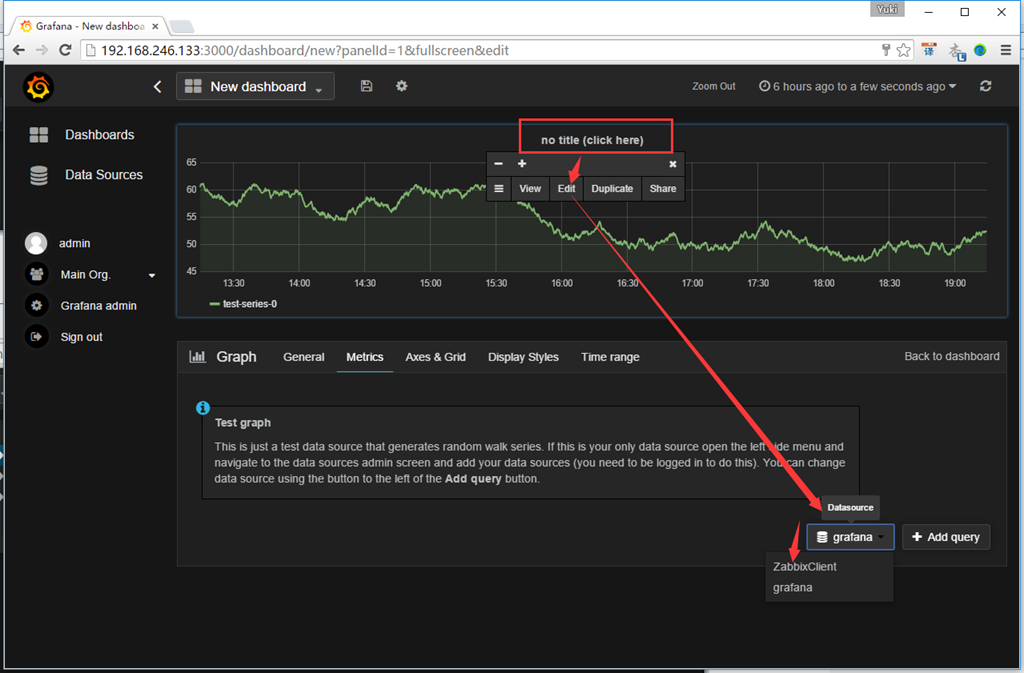
点击下列红框处->选择Edit->选择数据库ZabbixClient
然后配置一下,就可以出现华丽丽的数据了,下图都是官方的示意图:


相关文章推荐
- Grafana + Zabbix --- 部署分布式监控系统
- Grafana + Zabbix --- 部署分布式监控系统
- Grafana + Zabbix + MySQL --- 部署分布式监控系统
- Zabbix:企业级分布式系统监控部署 ( ERIKXUE 薛忠权 奋斗在京)
- 分布式监控系统Zabbix--使用Grafana进行图形展示
- 分布式监控系统Zabbix-3.0.3-完整安装记录(5)-邮件报警部署
- 分布式监控系统Zabbix-3.0.3-完整安装记录(6)-微信报警部署
- 转角遇到Zabbix:企业级分布式系统监控部署
- 简单安装 分布式监控系统 Zabbix 2.0.6
- CentOS6.6+Puppet3.7.3分布式部署Zabbix2.4监控系统
- 分布式系统部署、监控与进程管理的几重境界
- Hadoop集群中部署Ganglia分布式监控系统
- 分布式系统部署、监控与进程管理的几重境界
- 企业级分布式监控系统Zabbix系列之01(Zabbix-Server安装)
- CentOS6.6+Puppet3.7.3分布式部署Zabbix2.4监控系统 推荐
- 分布式系统部署、监控与进程管理的几重境界
- 分布式系统部署、监控与进程管理的几重境界
- zabbix分布式监控系统安装(一)
- Zabbix监控和分布式部署实施方案
- Zabbix监控和分布式部署实施方案