python可视化之直方图的绘制
2016-09-14 21:25
302 查看
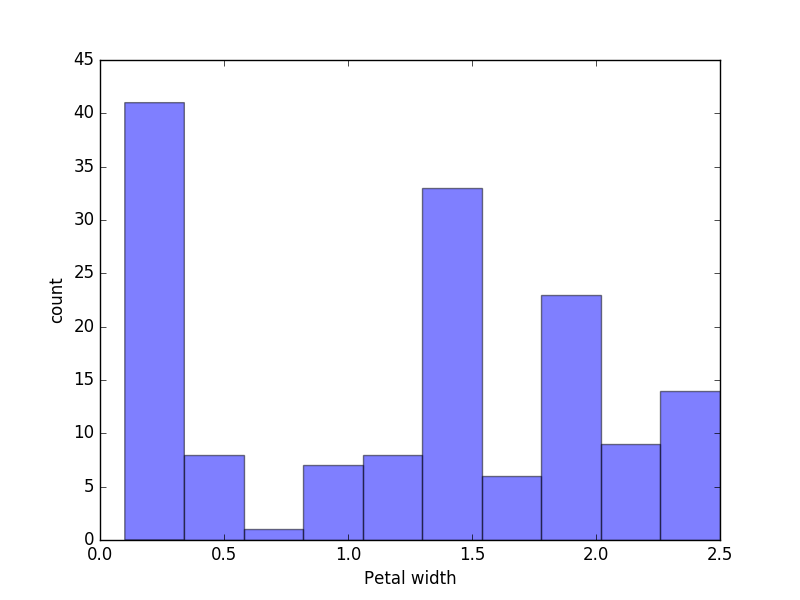
本文绘制直方图使用的数据集为Iris,下载地址在http://archive.ics.uci.edu/ml/。
这里以Petal width为例,绘制结果如下:
from matplotlib import pyplot as plt
'''
count of Petal width
'''
file=open("../dataset/iris.txt", "r")
content = [x.rstrip("\n") for x in file]
file.close()
d_sl=[]
while '' in content:
content.remove('')
data_slength = [x.split(',')[3] for x in content[0:]]
while '' in data_slength:
data_slength.remove('')
for i in data_slength:
d_sl.append(float(i))

plt.hist(d_sl,10,alpha=0.5)
plt.xlabel("Petal width")
plt.ylabel("count")
plt.show()
这里以Petal width为例,绘制结果如下:

相关文章推荐
- Python进阶(三十八)-数据可视化の利用matplotlib 进行折线图,直方图和饼图的绘制
- Python:使用pycha快速绘制办公常用图(饼图、垂直直方图、水平直方图、散点图等七种图形)
- 利用Python绘制MySQL数据图实现数据可视化
- [置顶] 【python 可视化】python利用matplotlib库绘制饼图案例
- python opencv入门 直方图计算、绘制、分析(22)
- 特征选择与评分的可视化显示 - 在Python中使用Matplotlib绘制“横着的”条形图
- Python:使用pycha快速绘制办公常用图(饼图、垂直直方图、水平直方图、散点图等七种图形)
- Python中的pygal安装和绘制直方图代码分享
- python pygal绘制直方图
- Python绘制直方图(Histograms)—从文件中读取数据画图update@2017-05-17
- python 数据可视化 matplotlib学习一:绘制简单的折线图
- Python使用pylab绘制直方图
- Matplotlib入门:Python的可视化绘制工具包
- Python与图像处理(1):绘制图像,点和线,图像轮廓,直方图
- python数据可视化----绘制各种图形
- Python:使用pycha快速绘制办公常用图(饼图、垂直直方图、水平直方图、散点图等七种图形)
- 利用python进行折线图,直方图和饼图的绘制
- python可视化之散点图的绘制
- [置顶] 【python 数据可视化 】饼图,箱线图,条形图,直方图,折线图,散点图
- python数据可视化——利用pyplot绘制折线图和散点图