Python调用Matplotlib绘制分布点图
2016-08-04 15:38
761 查看
Python调用Matplotlib代码绘制分布点
绘制点图的目的
Matplotlib简介
代码
截图
1.绘制点图的目的
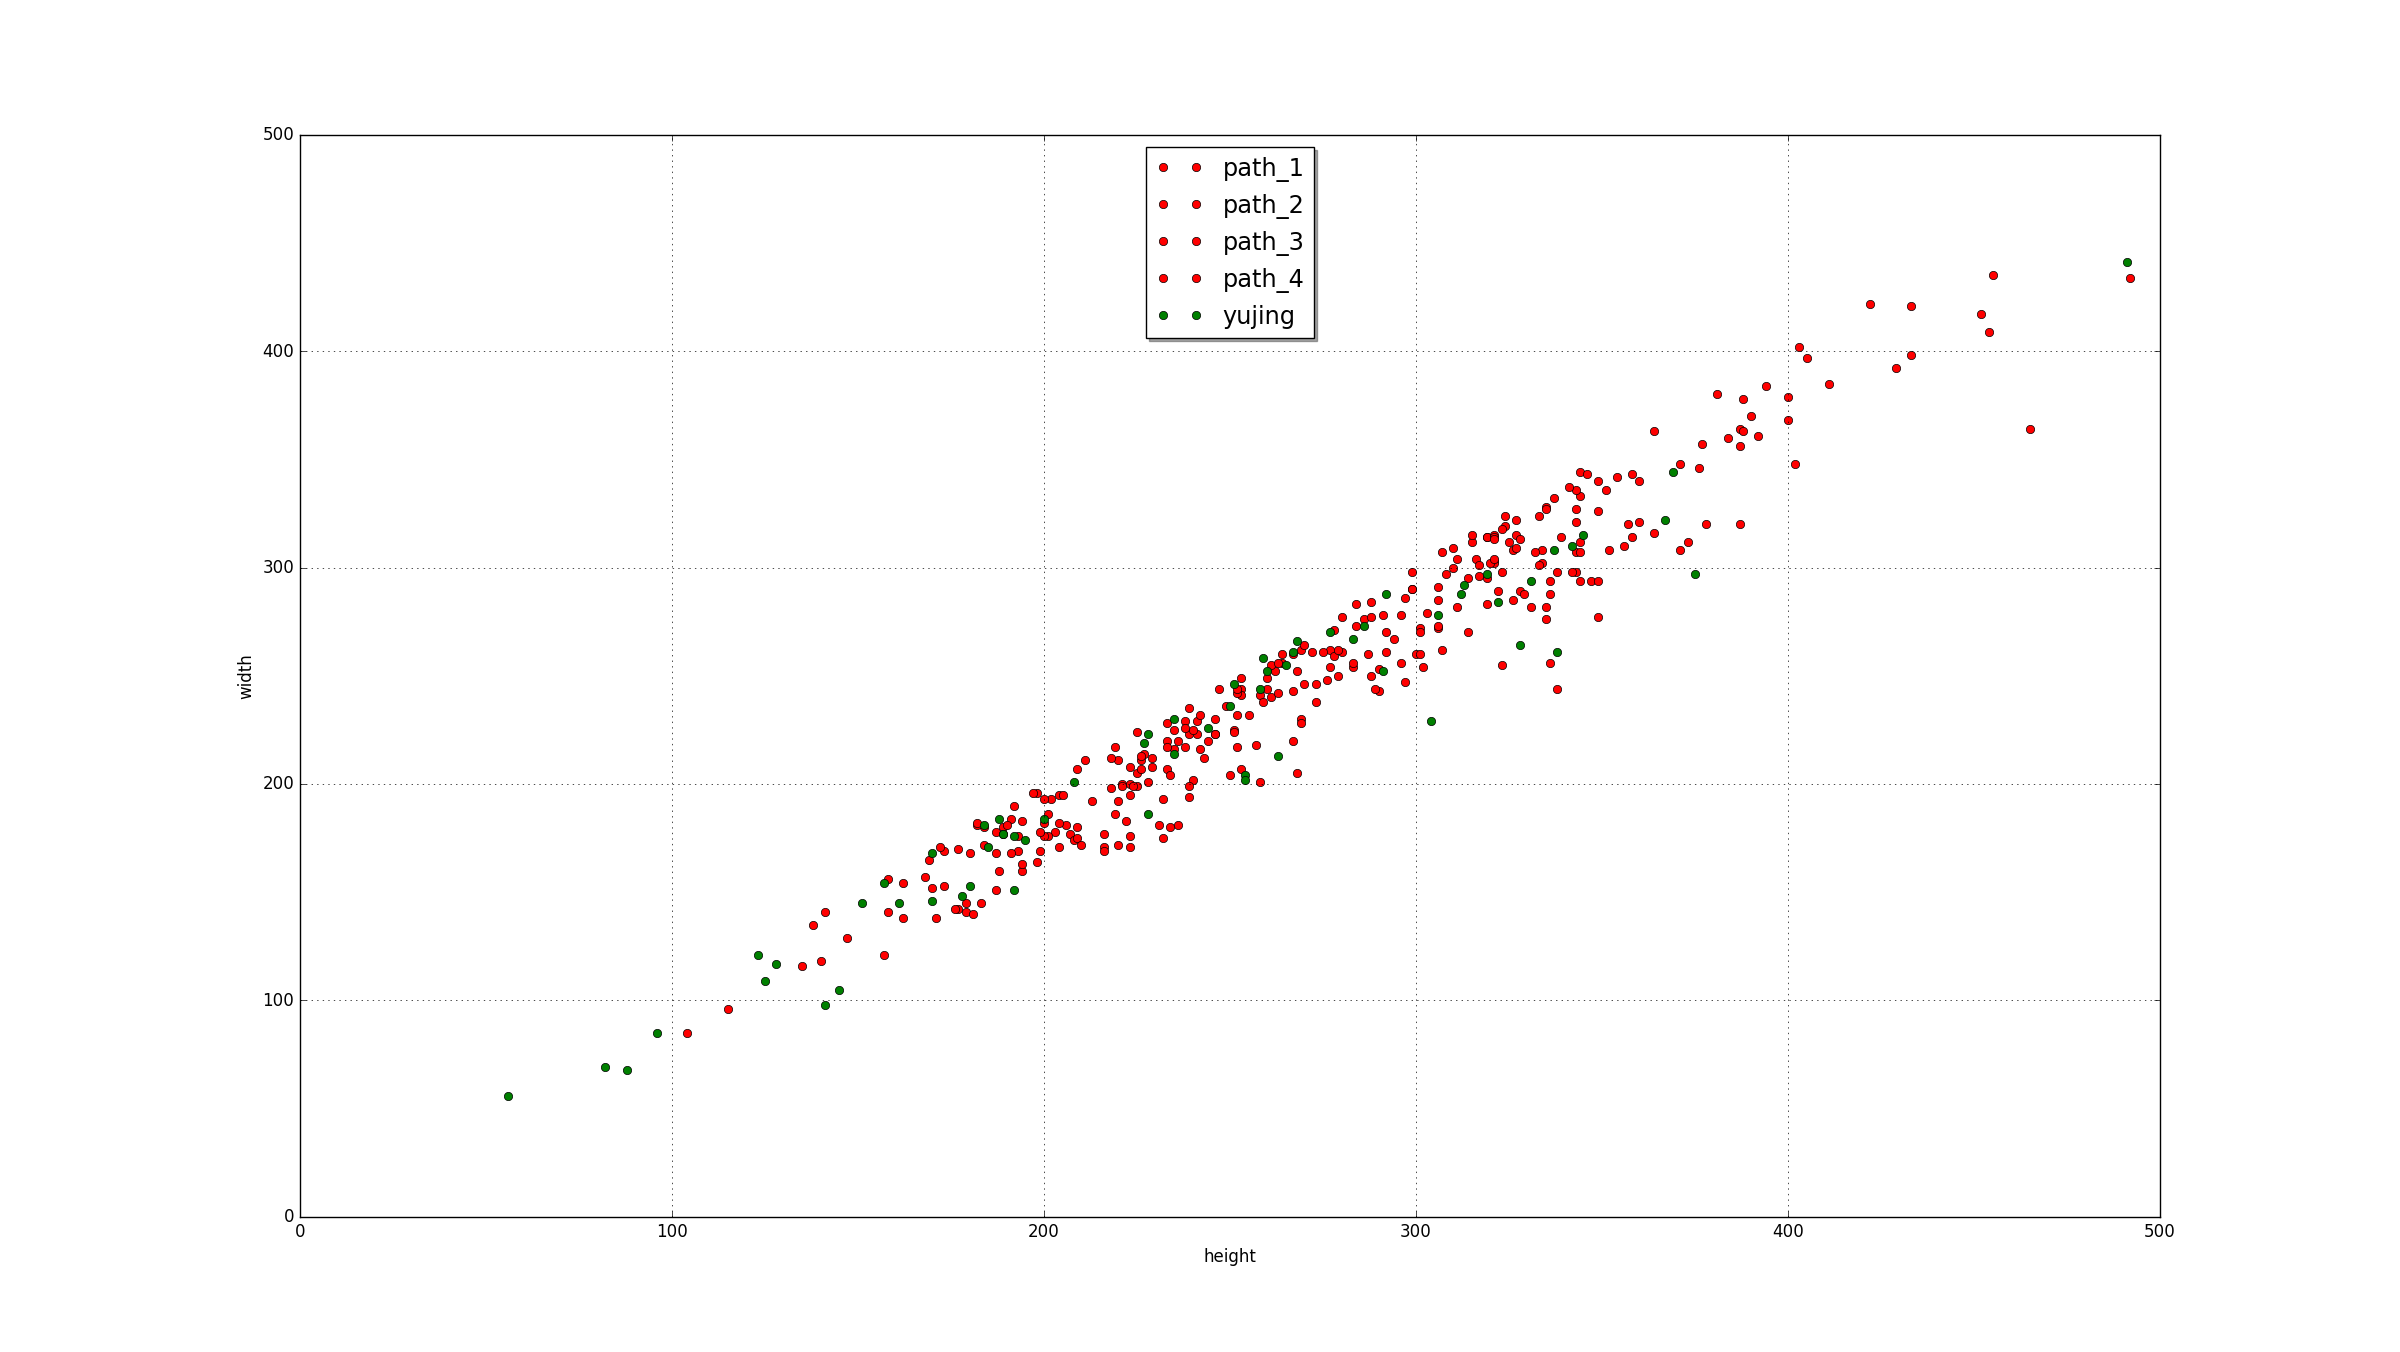
我们实验室正在做关于人脸识别的项目,其中在人脸检测后,会有些误检的图片,但是其中就有很多不符合的。很明显的是从图片大小,就可以过滤掉一部分。老大交给我的工作,就是通过绘制图片width,height的分布图,来找到一个合理的阈值。
2.Matlablib简介
Matplotlib是一个Python的图形框架
下面是官网的例子
Matplotlib example
3.代码如下
4.显示结果
绘制点图的目的
Matplotlib简介
代码
截图
1.绘制点图的目的
我们实验室正在做关于人脸识别的项目,其中在人脸检测后,会有些误检的图片,但是其中就有很多不符合的。很明显的是从图片大小,就可以过滤掉一部分。老大交给我的工作,就是通过绘制图片width,height的分布图,来找到一个合理的阈值。
2.Matlablib简介
Matplotlib是一个Python的图形框架
下面是官网的例子
Matplotlib example
3.代码如下
import matplotlib.pyplot as plt
from numpy.random import rand
import numpy
import os
import cv2

#setting plt
plt.xlim(xmax=500,xmin=0)
plt.ylim(ymax=500,ymin=0)
plt.xlabel("height")
plt.ylabel("width")

path_1 = r'D:\zhangjichao\view\path_1'

x = []
y = []
files = os.listdir(path_1)
for f in files:
img = cv2.imread(path_1 + '\\' + f)
x.append(img.shape[0])
y.append(img.shape[1])
plt.plot(x,y,'ro',color='red',label='path_1')

path_2 = r'D:\zhangjichao\view\path_2'

x = []
y = []
files = os.listdir(path_2)
for f in files:
img = cv2.imread(path_2 + '\\' + f)
x.append(img.shape[0])
y.append(img.shape[1])
plt.plot(x,y,'ro',color='red',label='path_2')

path_3 = r'D:\zhangjichao\view\path_3'

x = []
y = []
files = os.listdir(path_3)
for f in files:
img = cv2.imread(path_3 + '\\' + f)
x.append(img.shape[0])
y.append(img.shape[1])
plt.plot(x,y,'ro',color='red',label='path_3')

path_4 = r'D:\zhangjichao\view\path_4'

x = []
y = []
files = os.listdir(path_4)
for f in files:
img = cv2.imread(path_4 + '\\' + f)
x.append(img.shape[0])
y.append(img.shape[1])
plt.plot(x,y,'ro',color='red',label='path_4')

yujing = r'D:\zhangjichao\view\xujing'

x = []
y = []
files = os.listdir(yujing)
for f in files:
img = cv2.imread(yujing + '\\' + f)
x.append(img.shape[0])
y.append(img.shape[1])
plt.plot(x,y,'ro',color='green' , label='yujing')

#图例
plt.legend(loc='upper center', shadow=True, fontsize='x-large')
plt.grid(True)

#显示
plt.show()
4.显示结果

相关文章推荐
- Python调用Matplotlib绘制分布点并且添加标签
- python调用Matplotlib绘制分布点并且添加标签
- Python:使用matplotlib绘制图表
- Python图表绘制:matplotlib绘图库入门
- qt c++调用python的matplotlib脚本
- Python图表绘制:matplotlib绘图库入门
- Python图表绘制:matplotlib绘图库入门
- Python图表绘制:matplotlib绘图库入门
- Python图表绘制:matplotlib绘图库入门
- Python图表绘制:matplotlib绘图库入门
- Python使用matplotlib绘制动画的方法
- python使用matplotlib绘制xy坐标轴图
- Python图表绘制:matplotlib绘图库入门
- python实战二:使用CSV数据绘制带数据标志的折线图(matplotlib)
- lozi混沌映射吸引子,使用python的matplotlib绘制,可以放大和缩小
- 用Python的Matplotlib绘制LaTeX用的论文插图替代Matlab等收费软件终将成为时尚
- Python图表绘制:matplotlib绘图库入门
- matplotlib--python绘制图表 | PIL--python图像处理
- Python图表绘制:matplotlib绘图库入门
- python中matplotlib绘制图形