HighChart学习-更新数据data Series与重绘
2016-07-29 00:00
113 查看
一:HighChart介绍
基于JQuery的纯JavaScript的图标库,支持各种图表显示,同时还支持Mootools
与Prototype详细版本支持在这里:
支持目前市场几乎所有的主要浏览器IE, Chrome, FF,Safari, Opera等。其图形渲染完
全是是基于SVG与VML方式,其中VML方式主要是兼容IE浏览器,在IE9+及其它浏览
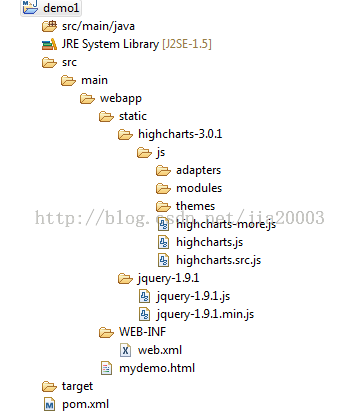
器上渲染技术都是基于SVG方式。下载与安装指导文档
->http://docs.highcharts.com/#home安装好以后,建一个基本static web 项目,如图
所示:
二:HighChart基本的Bar Chart演示
打开链接->http://docs.highcharts.com/#your-first-chart
拷贝your first chart中第二步中的全部script脚本到mydemo.html中的<script></script>
之间。导入JQuery与highchart库文件支持。代码如下:
<scriptsrc="static/jquery-1.9.1/jquery-1.9.1.min.js"></script>
<scriptsrc="static/highcharts-3.0.1/js/highcharts.js"></script>
在tomcat中部署demo1之后访问如下URL:http://localhost:8080/demo1/mydemo.html
在浏览器中看到如下Bar Chart:

三:清除HighChart中的数据集(remove data series from high chart object)
代码修改:
1. 把type:’bar’ 改成type: ’column’ 其作用是让bar垂直显示
2. 向script尾部追加如下代码,自动清除所有series然后刷新
setTimeout(function(){
var series=chart.series;
while(series.length > 0) {
series[0].remove(false);
}
chart.redraw();
},2000);
四:向HighChart中添加data series(add new data series into high chart object)
向script的尾部追加如下代码,实现添加data series并刷新bar chart
setTimeout(function(){
chart.addSeries({
id:1,
name:"gloomyfish",
data:[1,2,3]
},false);
chart.addSeries({
id:2,
name:"wang-er-ma",
data:[5,2,1]
},false);
chart.addSeries({
id:3,
name:"zhang-san",
data:[4,8,6]
},false);
chart.redraw();
},2000);
addSeries方法中第二个参数false表示不重绘plot,等所有series添加完成调用redraw
方法重绘。
五:在chart中清除high chart官方链接(remove high chart official hyperlink in chart)
仔细观察在Bar Chart的右下角有个highchart的官方链接,当然希望去掉,只要在chart
声明中将credits声明设置改为false即可。代码如下:
credits: {enabled: false// remove high chart logo hyper-link},
六:完整Demo源码
运行效果如下:

基于JQuery的纯JavaScript的图标库,支持各种图表显示,同时还支持Mootools
与Prototype详细版本支持在这里:
| JQuery | 1.3.2 - 1.9.x. 2.0.x for modern browsers |
| Mootools | 1.2.5 - 1.4.5 |
| Prototype | 1.7 |
全是是基于SVG与VML方式,其中VML方式主要是兼容IE浏览器,在IE9+及其它浏览
器上渲染技术都是基于SVG方式。下载与安装指导文档
->http://docs.highcharts.com/#home安装好以后,建一个基本static web 项目,如图
所示:
二:HighChart基本的Bar Chart演示
打开链接->http://docs.highcharts.com/#your-first-chart
拷贝your first chart中第二步中的全部script脚本到mydemo.html中的<script></script>
之间。导入JQuery与highchart库文件支持。代码如下:
<scriptsrc="static/jquery-1.9.1/jquery-1.9.1.min.js"></script>
<scriptsrc="static/highcharts-3.0.1/js/highcharts.js"></script>
在tomcat中部署demo1之后访问如下URL:http://localhost:8080/demo1/mydemo.html
在浏览器中看到如下Bar Chart:
三:清除HighChart中的数据集(remove data series from high chart object)
代码修改:
1. 把type:’bar’ 改成type: ’column’ 其作用是让bar垂直显示
2. 向script尾部追加如下代码,自动清除所有series然后刷新
setTimeout(function(){
var series=chart.series;
while(series.length > 0) {
series[0].remove(false);
}
chart.redraw();
},2000);
四:向HighChart中添加data series(add new data series into high chart object)
向script的尾部追加如下代码,实现添加data series并刷新bar chart
setTimeout(function(){
chart.addSeries({
id:1,
name:"gloomyfish",
data:[1,2,3]
},false);
chart.addSeries({
id:2,
name:"wang-er-ma",
data:[5,2,1]
},false);
chart.addSeries({
id:3,
name:"zhang-san",
data:[4,8,6]
},false);
chart.redraw();
},2000);
addSeries方法中第二个参数false表示不重绘plot,等所有series添加完成调用redraw
方法重绘。
五:在chart中清除high chart官方链接(remove high chart official hyperlink in chart)
仔细观察在Bar Chart的右下角有个highchart的官方链接,当然希望去掉,只要在chart
声明中将credits声明设置改为false即可。代码如下:
credits: {enabled: false// remove high chart logo hyper-link},
六:完整Demo源码
<html>
<head>
<script src="static/jquery-1.9.1/jquery-1.9.1.min.js"></script>
<script src="static/highcharts-3.0.1/js/highcharts.js"></script>
<title>My Demo 1</title>
<script>
$(function() {
var chart;

// initialization chart and actions
$(document).ready(function () {
chart = new Highcharts.Chart({
chart: {
renderTo: 'my_container',
type: 'column'
},
title: {
text: 'Fruit Consumption'
},
xAxis: {
categories: ['Apples', 'Bananas', 'Oranges']
},
yAxis: {
title: {
text: 'Fruit eaten'
}
},
credits: {
enabled: false // remove high chart logo hyper-link
},
series: [{
name: 'Jane',
data: [1, 0, 4]
}, {
name: 'John',
data: [5, 7, 3]
}]
});

// JQuery, mouse click event bind with dom buttons
$('#clear-button').on('click', function (e) {
clearPlot();
});

$('#refresh-button').on('click', function (e) {
refreshPlot();
});
});

// clear all series of the chart
function clearPlot() {
//console.log("clear plot data!!!");
var series=chart.series;
while(series.length > 0) {
series[0].remove(false);
}
chart.redraw();
};

function refreshPlot() {
//console.log("refresh plot data!!!");
chart.addSeries({
id:1,
name: "gloomyfish",
data: [1,2,3]
}, false);
chart.addSeries({
id:2,
name: "wang-er-ma",
data: [5,2,1]
}, false);
chart.addSeries({
id:3,
name: "zhang-san",
data: [4,8,6]
}, false);

chart.redraw();
};

setTimeout(function(){
var series=chart.series;
while(series.length > 0) {
series[0].remove(false);
}
chart.redraw();
},2000);

// add new series for the chart
setTimeout(function(){
chart.addSeries({
id:1,
name: "gloomyfish",
data: [1,2,3]
}, false);
chart.addSeries({
id:2,
name: "wang-er-ma",
data: [5,2,1]
}, false);
chart.addSeries({
id:3,
name: "zhang-san",
data: [4,8,6]
}, false);

chart.redraw();
},2000);
});
</script>
</head>
<body>
<h1>High Chart Demo 1</h1>
<div id="my_container" style="width:600px; height:600px;"></div>
<div id="btn-group">
<button type="button" id="clear-button">Clear Plot</button>
<button type="button" id="refresh-button">Draw Plot</button>
</div>
</body>
</html>
运行效果如下:

相关文章推荐
- Java数字图像处理基础知识 - 必读
- 盛大创新院赞助首届.NET技术交流会开始报名了!
- 最容易令初学者混乱的F#命令
- 图像处理之基于泛红算法的二值图像内部区域填充
- Enterprise Library 2.0 Test Guide下载
- 有些话不知道怎么说才好
- 图像处理之计算连通区域的角度方向
- 谈表达式树的缓存(5):引入散列值
- 自己动手生成评论RSS
- 【翻译】你应该了解的三种广域网协议:HDLC、PPP、Frame-Relay
- 写什么样的文章关注的人会多一些呢?
- 视频:Microsoft PDC 09,算法及数据结构内容及其他
- 10月份的MSDN Magazine中CLR Inside Out栏目是一篇关于IronPython的文章
- 有关注册DataItem的一些可能被忽视的事情
- 适合ASP.NET MVC的视图片断缓存方式(下):页面输出原则
- 最近的精神状态不太好
- F#中的异步及并行模式(3 - 下):代理的进一步使用
- 谈表达式树的缓存(1):引言
- 定制Paste from Visual Studio插件(下)
- 统计一个表达式树拥有的节点数量