ArcGIS JS 学习笔记3 实现百度风格的BubblePopup
2016-06-07 08:41
579 查看
1. 开篇
模仿是最好的学习,这次我们继续山寨百度,通过自定义Infowindow来实现百度风格的BubblePopup<!DOCTYPE html>
<html lang="en">
<head>
<meta charset="UTF-8">
<title>DExtra-BubublPoopup</title>
<link rel="stylesheet" href="https://js.arcgis.com/3.16/esri/css/esri.css">
<link rel="stylesheet" href="../dist/dijit/css/dextraPopup.css">
<link rel="stylesheet" href="css/mainApp.css">
<script>
var dojoConfig = {
parseOnLoad:true,
packages: [{
name: 'custom',
location: location.pathname.replace(/\/[^/]+$/, '') + '/custom'//从cdn加载自己定义的模块方法
},
{
name: 'dextra',
location: '/extra.arcgis.3.x/dist/'//从cdn加载自己定义的模块方法
}]
};
</script>
<script src="https://js.arcgis.com/3.16/"></script>
<script>
require([
"dojo/dom",
"dojo/on",
"esri/map",
"esri/symbols/SimpleMarkerSymbol",
"esri/InfoTemplate",
"esri/layers/GraphicsLayer",
"dextra/layers/GoogleVectorLayer",
"dextra/dijit/DEBubblePopup",
"dojo/domReady!"],
function (dom, on,
Map, Graphic, SimpleMarkerSymbol, InfoTemplate, GraphicsLayer,
GoogleVectorLayer,DEBubblePopup) {
var infoWindow = new DEBubblePopup();
var map = new Map("map", {
showAttribution: false,
center: [102.3, 24.6],
autoResize: true,
sliderPosition: "bottom-right",
logo: false,
infoWindow:infoWindow,
zoom:12
});
var googleVect = new GoogleVectorLayer();
map.addLayer(googleVect);
var measureLayer = new GraphicsLayer({id: "infoWindowTest"});
map.addLayer(measureLayer);
on(dom.byId("infowindow"), "click", function (e) {
on.once(map, "click", function (evt) {
console.log(map._container);
var sms = new SimpleMarkerSymbol({
"color": [255, 0, 0],
"size": 12,
"xoffset": 0,
"yoffset": 0,
"type": "esriSMS",
"style": "esriSMSCircle",
"outline": {
"color": [0, 0, 0, 255],
"width": 1,
"type": "esriSLS",
"style": "esriSLSSolid"
}
});
var point = map.toMap(evt.screenPoint);
var attr = {"Xcoord": point.x, "Ycoord": point.y, "Plant": "Mesa Mint"};
var infoTemplate = new InfoTemplate("Locations", "Latitude: ${Ycoord} Longitude: ${Xcoord}Plant Name:${Plant}");
var graphic=new Graphic(point, sms,attr,infoTemplate);
measureLayer.add(graphic);
});
});
});
</script>
<style>
#measureTools {
position: absolute;
top: 50px;
left: 50px;
z-index: 1000;
}
</style>
</head>
<body>
<div id="measureTools">
<button id="infowindow">弹出框</button>
</div>
<div id="map" ></div>
</body>
</html>View Code
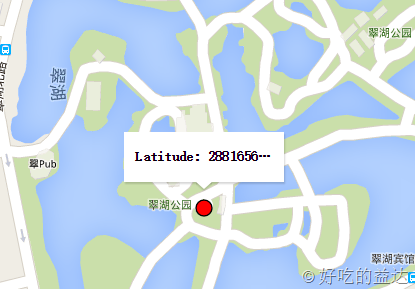
效果截图:
3.1 小结
可以看到,通过继承InfoWindowBase我们完全可以实现自己的的infoWindow,编写更具个性化的插件。最后像新手玩家推荐一下esri的github,这里有很多有用的东西,非常值得学习http://esri.github.io/。
本文参考了 /article/1659885.html 谢谢lzugis的分享。
欢迎转载 http://www.cnblogs.com/deliciousExtra/p/5565787.html

相关文章推荐
- js data日期初始化的5种方法
- Javascript之spry菜单栏
- JavaScript 精粹
- JSP页面获取action传递过来的值
- JavaScript之Loading进度条
- primefaces 实现保存主题,使主题应用于所有JSF页面
- js中document对象详解
- javascript 操作cookie
- jsp+javascript实现动态下拉二级联动(select+option)
- javascript的高级面向对象基础
- 多种上传图片的方法
- 修改Eclipse中html/jsp代码对齐样式
- JavaScript引擎
- s捕捉异常处理是使用js try catch方式
- javaScript 为对象添加属性
- JavaScript中的一些特殊用法(二)
- Javascript神级代码!
- JavaScript 正则表达式上——基本语法
- JavaScript正则表达式下——相关方法
- javascript正则表达式