在项目中使用MPAndroidChart遇到的问题
2016-05-19 10:34
489 查看
在项目中使用MPAndroidChart遇到的问题
问题一 绘制折线图LineChart时 最右侧的垂线不显示
问题二 项目中某处坐标轴最后一个坐标需要显示醒目红色标记
个人认为比helloCharts强大很多.,不要问为啥.
但是画出来的时候最后一根Y轴现却显示不出来,而且X轴的坐标超出了屏幕,被裁切了.
一开始以为, 设置margin或padding,让图表距离边界有段距离就能显示出来, 但是尝试之后发现不可行.
MPAndroidChart提供了一个让X坐标轴的开始结束Label避免被裁切的方法xAxis.setAvoidFirstLastClipping(true),但是使用这个方法会让坐标轴显示的很难看. 老外的库对中文的处理还是差了一些.
我在翻看了MPAndroidChart的Issues时, 发现有人和我遇到了类似的问题
The last vertical line is not showing in the Line Chart #1723
经过我仔细思索, 我发觉最右侧的一根垂线不就是右侧的Y轴吗?
如果我设置了右侧的Y轴, 将右侧Y轴的文字设置成透明色, 那么最后侧的垂线不就显示出来了吗? 然后再给右侧Y轴设置偏移setXOffset()即可让图表显示在正确的位置了.
该问题解决完毕.
可以看到X轴的最后一个坐标值为红色.
我开始的想法是在最后一个坐标值的位置上盖一个蒙版之类的东西, 坐标显示的时候就能利用图像混合模式之类的技术让其看起来是红色的. 后来发现这样的思路实现起来基本不现实.
于是开始找MPAndroidChart的源码, 看看它是如何绘制X轴的坐标值的.
首先X轴有一个设置坐标值颜色的方法:
查看这个方法的源码, 定位到
只是给mTextColor成员变量赋值. 这个类中并没有使用到这个值, 但是注意到这个mTextColor的修饰符是protected, 可以向导, 肯定是某个子类使用到了该值. 但是我直接这样找没有找到关键位置.
于是我直接从LineChart类入手
LineChart中并没有关键代码, 只是注意到一个变量mXAxis, 这个变量并不是在LineChart中定义的, 继续找到父类BarLineChartBase.
在父类中找成员变量声明, 看到了一个关键的类XAxisRenderer.
进入XAxisRenderer类, 一眼就看到了设置画笔颜色的方法
那么成员变量mAxisLabelPaint就成了我寻找的关键. 肯定有改变画笔颜色的方法
仔细观察可以看到继承关系 XAxis –> AxisBase –> ComponentBase , 这个ComponentBase 就是我们最开始找的那个设置颜色方法的类. 一切似乎都清晰起来.
既然是使用画笔画的Text, 那么肯定会有canvas.drawText().继续向下找.
可以看到在drawLabel时, 默认使用的是mAxisLabelPaint, 那么如果我直接使用红色的画笔画的Text肯定就是红色了. 于是我先重载在这个方法
这样, 我只要在某种情况下将画笔的颜色改为红色, 我就能实现目的了. 接下来找到哪里调用drawLabel这个方法就成功了一半了.
可以找到方法调用关系 renderAxisLabels –> drawLabels –> drawLabel.
可以看到, 绘制坐标轴时按照坐标轴的位置和偏移量来绘制Label. 我们要修改的部分就是mXAxis.getPosition() == XAxisPosition.BOTTOM时的情况. 来看看drawLabels()方法. 这个方法在循环的绘制X轴的Label值.
这里注意到循环中mMaxX这个值, 这个值可以猜想是Labels的个数最大值, 那么我们重载这个方法, 让他在最大值的时候设置一个红色的画笔, 让最后一个label绘制成红色.下面就是我重载的方法:
这样的话, 我折线图LineChart最后一个X轴坐标的Label都变成红色的了. 显然这样是不行的. 因为我项目中其他地方也用到了折线图.
那么我注意到, 需要变为红色的Label只有是当我Label个数为7(也就是一周,索引为0~6)的情况. 其他时候都还要使用默认颜色. 庆幸的是我项目中只有一个地方Label个数为7, 要不然还真不好改. 根据调用关系我们找到renderAxisLabels().
我的思路: 根据我们项目中的实际情况,让renderAxisLabels()调用我重载的drawLabels()方法即可. 然后再根据情况让drawLabels()调用我重载的drawLabel()即可.
那么我就需要修改renderAxisLabels()方法了.
至此, 我项目中要达到的效果就已经完成了. 这样修改之后的MPAndroidChart就成了我项目的专属了. 不能复用. 虽然依照开闭原则, 这样的直接修改源码的方式很不好, 但是这也是没有办法的办法了. 总算我项目中的问题是解决了.
最后, 感谢MPAndroidChart的作者PhilJay, 让我们能如此简单的绘制出漂亮的图表, 我看到您一直在努力的维护着这个库. 再次感谢您的付出!
问题一 绘制折线图LineChart时 最右侧的垂线不显示
问题二 项目中某处坐标轴最后一个坐标需要显示醒目红色标记
在项目中使用MPAndroidChart遇到的问题
MPAndroidChart的github地址: https://github.com/PhilJay/MPAndroidChart个人认为比helloCharts强大很多.,不要问为啥.
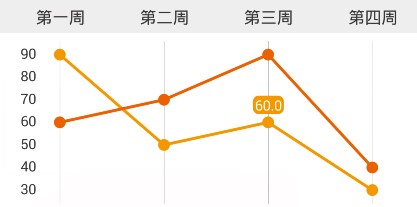
问题一: 绘制折线图LineChart时, 最右侧的垂线不显示.
效果图是这样的但是画出来的时候最后一根Y轴现却显示不出来,而且X轴的坐标超出了屏幕,被裁切了.
一开始以为, 设置margin或padding,让图表距离边界有段距离就能显示出来, 但是尝试之后发现不可行.
MPAndroidChart提供了一个让X坐标轴的开始结束Label避免被裁切的方法xAxis.setAvoidFirstLastClipping(true),但是使用这个方法会让坐标轴显示的很难看. 老外的库对中文的处理还是差了一些.
我在翻看了MPAndroidChart的Issues时, 发现有人和我遇到了类似的问题
The last vertical line is not showing in the Line Chart #1723
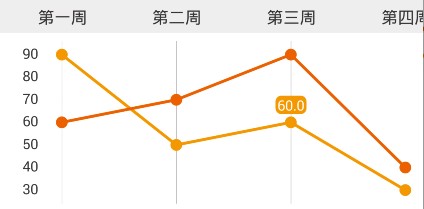
经过我仔细思索, 我发觉最右侧的一根垂线不就是右侧的Y轴吗?
如果我设置了右侧的Y轴, 将右侧Y轴的文字设置成透明色, 那么最后侧的垂线不就显示出来了吗? 然后再给右侧Y轴设置偏移setXOffset()即可让图表显示在正确的位置了.
YAxis rightAxis = lineChart.getAxisRight();
rightAxis.setDrawAxisLine(true);
rightAxis.setDrawGridLines(false);
rightAxis.setTextColor(Color.TRANSPARENT);
rightAxis.setPosition(YAxis.YAxisLabelPosition.OUTSIDE_CHART);
rightAxis.setXOffset(15f);
该问题解决完毕.
问题二: 项目中某处坐标轴最后一个坐标需要显示醒目红色标记
效果图是这样的可以看到X轴的最后一个坐标值为红色.
我开始的想法是在最后一个坐标值的位置上盖一个蒙版之类的东西, 坐标显示的时候就能利用图像混合模式之类的技术让其看起来是红色的. 后来发现这样的思路实现起来基本不现实.
于是开始找MPAndroidChart的源码, 看看它是如何绘制X轴的坐标值的.
首先X轴有一个设置坐标值颜色的方法:
xAxis.setTextColor(Color.BLACK);
查看这个方法的源码, 定位到
com.github.mikephil.charting.components.ComponentBase#setTextColor
/**
* the text color to use for the labels
*/
protected int mTextColor = Color.BLACK;

public void setTextColor(int color) {
mTextColor = color;
}
只是给mTextColor成员变量赋值. 这个类中并没有使用到这个值, 但是注意到这个mTextColor的修饰符是protected, 可以向导, 肯定是某个子类使用到了该值. 但是我直接这样找没有找到关键位置.
于是我直接从LineChart类入手
public class LineChart extends BarLineChartBase<LineData> implements LineDataProvider
LineChart中并没有关键代码, 只是注意到一个变量mXAxis, 这个变量并不是在LineChart中定义的, 继续找到父类BarLineChartBase.
在父类中找成员变量声明, 看到了一个关键的类XAxisRenderer.
protected XAxisRenderer mXAxisRenderer;
进入XAxisRenderer类, 一眼就看到了设置画笔颜色的方法
public class XAxisRenderer extends AxisRenderer {
protected XAxis mXAxis; //X轴
public XAxisRenderer(ViewPortHandler viewPortHandler, XAxis xAxis, Transformer trans) {
super(viewPortHandler, trans);
this.mXAxis = xAxis;
mAxisLabelPaint.setColor(Color.BLACK); //设置绘制Label的画笔默认颜色为黑色
mAxisLabelPaint.setTextAlign(Align.CENTER);
mAxisLabelPaint.setTextSize(Utils.convertDpToPixel(10f));
}
//.......
}
那么成员变量mAxisLabelPaint就成了我寻找的关键. 肯定有改变画笔颜色的方法
mAxisLabelPaint.setTypeface(mXAxis.getTypeface());
mAxisLabelPaint.setTextSize(mXAxis.getTextSize());
mAxisLabelPaint.setColor(mXAxis.getTextColor()); //改变画笔颜色
仔细观察可以看到继承关系 XAxis –> AxisBase –> ComponentBase , 这个ComponentBase 就是我们最开始找的那个设置颜色方法的类. 一切似乎都清晰起来.
既然是使用画笔画的Text, 那么肯定会有canvas.drawText().继续向下找.
protected void drawLabel(Canvas c, String label, int xIndex, float x, float y, PointF anchor,float angleDegrees) {
String formattedLabel = mXAxis.getValueFormatter().getXValue(label, xIndex,mViewPortHandler);
Utils.drawText(c, formattedLabel, x, y, mAxisLabelPaint, anchor, angleDegrees);//这里使用画笔画Text
}
可以看到在drawLabel时, 默认使用的是mAxisLabelPaint, 那么如果我直接使用红色的画笔画的Text肯定就是红色了. 于是我先重载在这个方法
protected void drawLabel(Canvas c, String label, int xIndex, Paint otherPaint, float x, float y, PointF anchor, float angleDegrees) {
String formattedLabel = mXAxis.getValueFormatter().getXValue(label, xIndex, mViewPortHandler);
Utils.drawText(c, formattedLabel, x, y, otherPaint, anchor, angleDegrees); //这里我使用传入的画笔绘制Text
}
这样, 我只要在某种情况下将画笔的颜色改为红色, 我就能实现目的了. 接下来找到哪里调用drawLabel这个方法就成功了一半了.
可以找到方法调用关系 renderAxisLabels –> drawLabels –> drawLabel.
public void renderAxisLabels(Canvas c) {
if (!mXAxis.isEnabled() || !mXAxis.isDrawLabelsEnabled())
return;
float yoffset = mXAxis.getYOffset();
mAxisLabelPaint.setTypeface(mXAxis.getTypeface());
mAxisLabelPaint.setTextSize(mXAxis.getTextSize());
mAxisLabelPaint.setColor(mXAxis.getTextColor());
if (mXAxis.getPosition() == XAxisPosition.TOP) { //坐标轴在顶部
drawLabels(c, mViewPortHandler.contentTop() - yoffset,new PointF(0.5f, 1.0f));
//....省略部分代码
} else if (mXAxis.getPosition() == XAxisPosition.BOTTOM) { //坐标轴在底部
drawLabels(c, mViewPortHandler.contentBottom() + yoffset,new PointF(0.5f, 0.0f));
}
//....省略部分代码
}
可以看到, 绘制坐标轴时按照坐标轴的位置和偏移量来绘制Label. 我们要修改的部分就是mXAxis.getPosition() == XAxisPosition.BOTTOM时的情况. 来看看drawLabels()方法. 这个方法在循环的绘制X轴的Label值.
/**
* draws the x-labels on the specified y-position
*/
protected void drawLabels(Canvas c, float pos, PointF anchor) {
final float labelRotationAngleDegrees = mXAxis.getLabelRotationAngle();
// pre allocate to save performance (dont allocate in loop)
float[] position = new float[]{
0f, 0f
};
for (int i = mMinX; i <= mMaxX; i += mXAxis.mAxisLabelModulus) {
position[0] = i;
mTrans.pointValuesToPixel(position);
if (mViewPortHandler.isInBoundsX(position[0])) {
String label = mXAxis.getValues().get(i);
if (mXAxis.isAvoidFirstLastClippingEnabled()) {
// avoid clipping of the last
if (i == mXAxis.getValues().size() - 1 && mXAxis.getValues().size() > 1) {
float width = Utils.calcTextWidth(mAxisLabelPaint, label);
if (width > mViewPortHandler.offsetRight() * 2
&& position[0] + width > mViewPortHandler.getChartWidth())
position[0] -= width / 2;
// avoid clipping of the first
} else if (i == 0) {
float width = Utils.calcTextWidth(mAxisLabelPaint, label);
position[0] += width / 2;
}
}
drawLabel(c, label, i, position[0], pos, anchor, labelRotationAngleDegrees);
}
}
}
这里注意到循环中mMaxX这个值, 这个值可以猜想是Labels的个数最大值, 那么我们重载这个方法, 让他在最大值的时候设置一个红色的画笔, 让最后一个label绘制成红色.下面就是我重载的方法:
protected void drawLabels(Canvas c, float pos, PointF anchor, boolean isNeedRed) {
final float labelRotationAngleDegrees = mXAxis.getLabelRotationAngle();
// pre allocate to save performance (dont allocate in loop)
float[] position = new float[]{
0f, 0f
};
for (int i = mMinX; i <= mMaxX; i += mXAxis.mAxisLabelModulus) {
//....省略部分代码
if (i == mMaxX && isNeedRed) { //如果是最后一个Label,并且是需要设置为红色
mAxisLabelPaint.setColor(Color.RED); //将画笔设置为红色
//调用我自己重载的drawLabel, 传入红色的画笔绘制
drawLabel(c, label, i, mAxisLabelPaint, position[0], pos, anchor, labelRotationAngleDegrees);
} else {
drawLabel(c, label, i, position[0], pos, anchor, labelRotationAngleDegrees);
}
}
}
}
这样的话, 我折线图LineChart最后一个X轴坐标的Label都变成红色的了. 显然这样是不行的. 因为我项目中其他地方也用到了折线图.
那么我注意到, 需要变为红色的Label只有是当我Label个数为7(也就是一周,索引为0~6)的情况. 其他时候都还要使用默认颜色. 庆幸的是我项目中只有一个地方Label个数为7, 要不然还真不好改. 根据调用关系我们找到renderAxisLabels().
我的思路: 根据我们项目中的实际情况,让renderAxisLabels()调用我重载的drawLabels()方法即可. 然后再根据情况让drawLabels()调用我重载的drawLabel()即可.
那么我就需要修改renderAxisLabels()方法了.
//.....省略部分代码
else if (mXAxis.getPosition() == XAxisPosition.BOTTOM) {
//当X轴位于底部,并且Label个数为7(索引0~6)时,我调用我重载的使用红色画笔绘制的方法
if (mMaxX == Calendar.DAY_OF_WEEK - 1) {
drawLabels(c, mViewPortHandler.contentBottom() + yoffset,
new PointF(0.5f, 0.0f), true); //我重载的需要红色画笔的方法
} else {
drawLabels(c, mViewPortHandler.contentBottom() + yoffset,
new PointF(0.5f, 0.0f));
}
}
//.....省略部分代码
至此, 我项目中要达到的效果就已经完成了. 这样修改之后的MPAndroidChart就成了我项目的专属了. 不能复用. 虽然依照开闭原则, 这样的直接修改源码的方式很不好, 但是这也是没有办法的办法了. 总算我项目中的问题是解决了.
最后, 感谢MPAndroidChart的作者PhilJay, 让我们能如此简单的绘制出漂亮的图表, 我看到您一直在努力的维护着这个库. 再次感谢您的付出!

相关文章推荐
- android studio 添加外部库的问题
- Android系统权限和root权限
- android动画之初学
- 在Android上打造属于自己的Rxjava框架(四)扩展成EventBus
- Android Studio 自动根据布局生成Activity
- Android Studio layout分组
- 使用IntelliJ IDEA(androidstudio前身)开发android移动应用前的基本设置,提高开发效率
- Android 代码混淆心得!
- 在Mac mini上编译Android源码
- android 自定义控件全系列导航
- Android FragmentTabhost实现选项卡
- Android开发之EditText属性详解
- android 中动态监听Edittext控件内容长度 TextWatcher监听事件
- Android sdk content loader 0%的解决方案
- Android插件化开发
- Android.mk中LOCAL_MODULE_TAGS的作用
- java/android/Process执行cmd命令行还可以进行封装
- android:wifi通信(一)
- Android.mk编译目标(编译包、二进制文件、预编译)
- Android——View的事件分发机制(学习Android开发艺术探索)