绘制折线图展示数据简单介绍-iOS客户端
2016-03-31 13:14
489 查看
在IOS开发的各种app中,有些项目难免会要求我们去使用图表的形式向用户展示一些数据,这就要求RD们需要使用代码根据数据去绘制图表视图,这里为大家介绍下在iOS端如何绘制折线图。先看下效果:
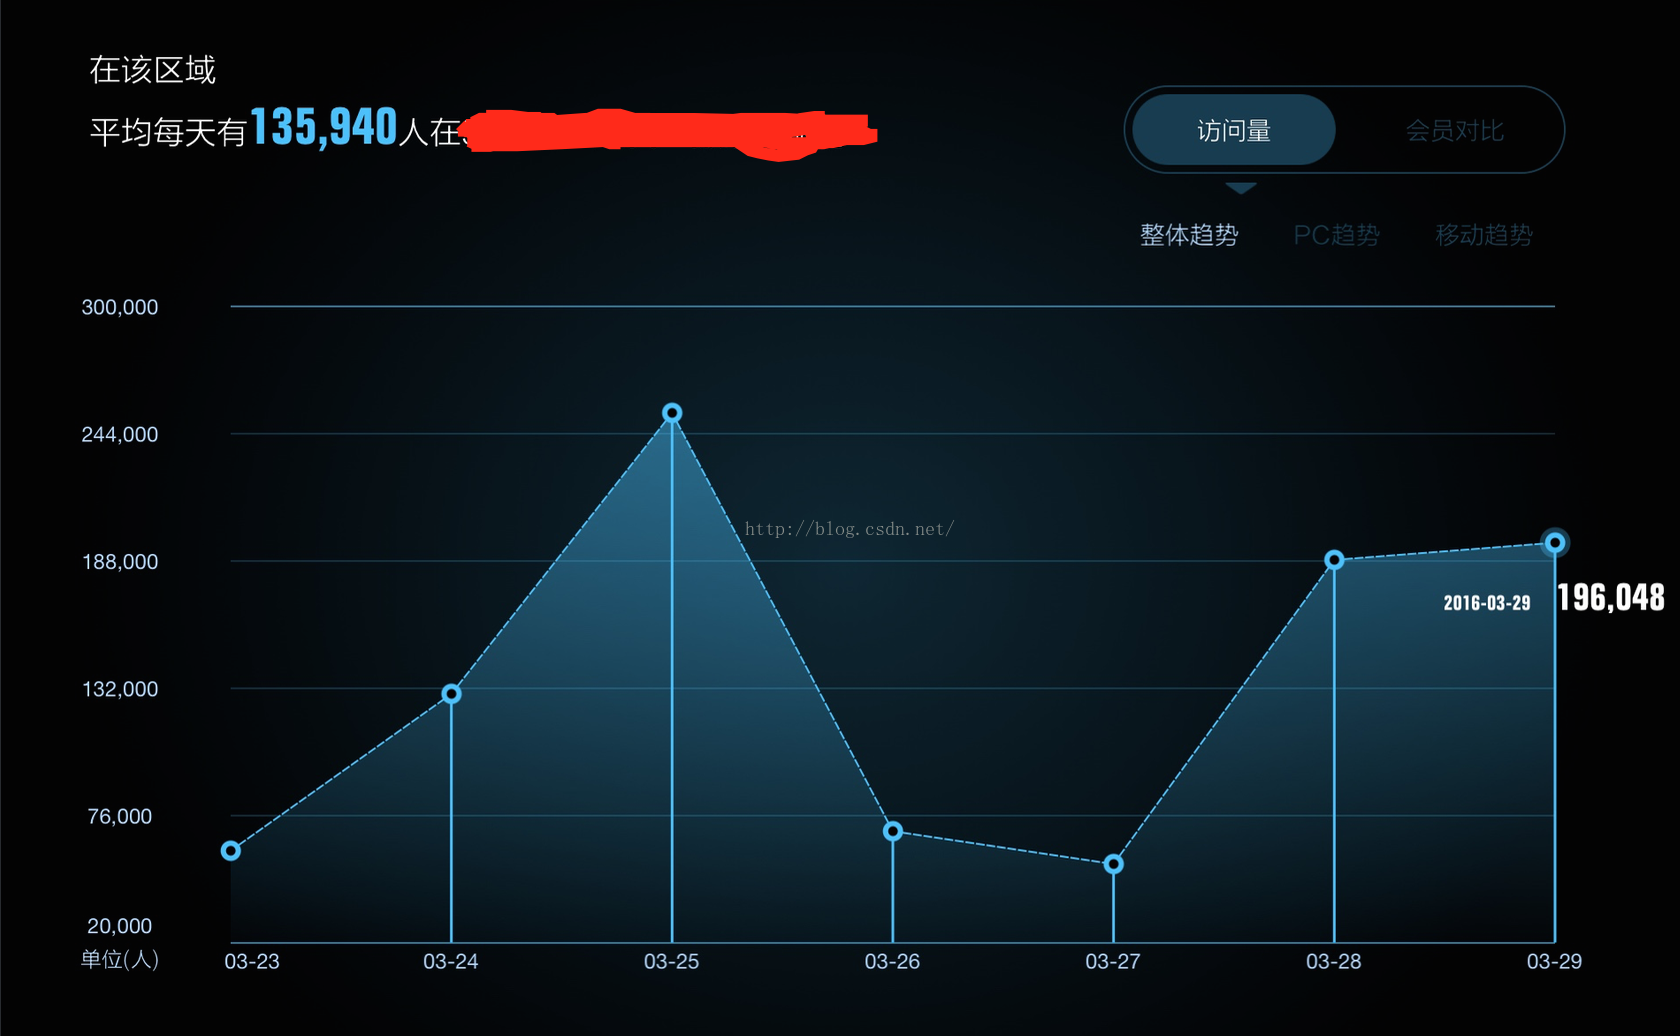
图1:单折线图
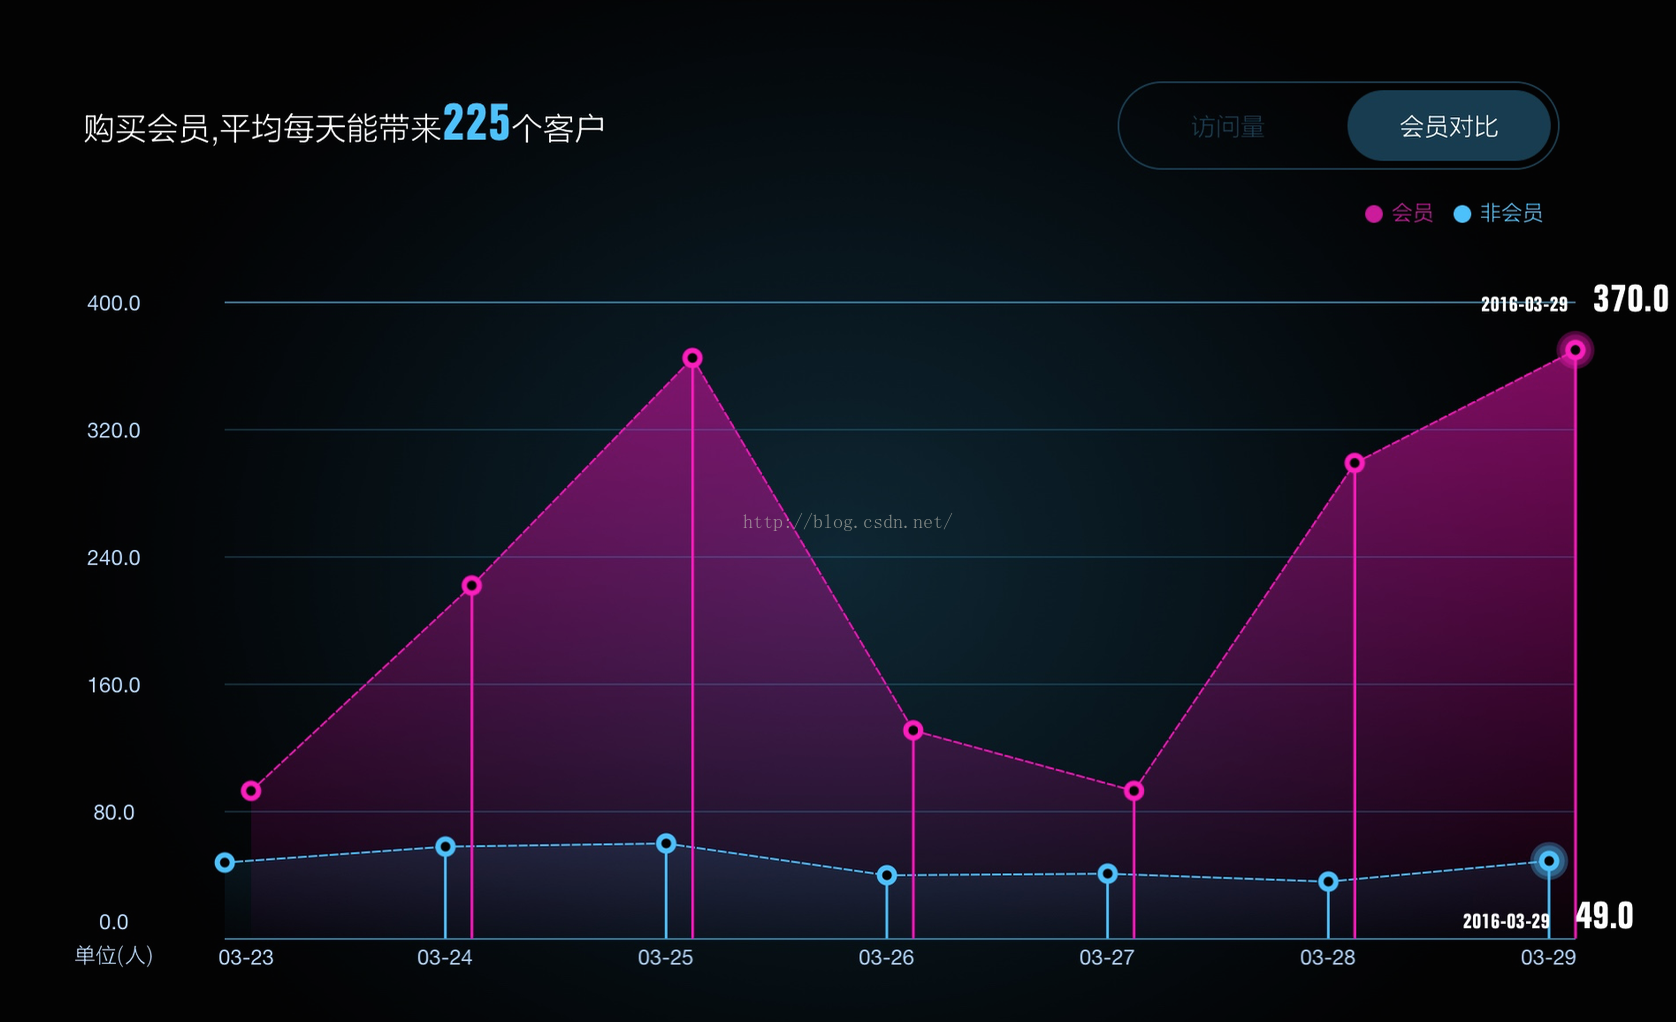
图2:双折线图
下面开始介绍如何绘制折线图,达到以上的效果。
第一步:数据源传递
折线图是根据app中的具体的数据来绘制的,其中包括了横坐标数据源、纵坐标数据源、单位、折线颜色值等等。
为了更好得解耦以及传值,我们选用代理的方式来传值。
在.h文件中声明个协议及协议的方法。
@protocol WBLineChartDataSource <NSObject>
@required
//横坐标标题数组
- (NSMutableArray *)WBLineChart_xTitleArray:(WBLineChart *)chart;
//数值多重数组
- (NSMutableArray *)WBLineChart_yTitleArray:(WBLineChart *)chart;
@optional
//颜色数组
- (NSMutableArray *)WBLineChart_colorArray:(WBLineChart *)chart;
//显示数值范围
- (CGRange)WBLineChartRangeOfYValue:(WBLineChart *)chart;
#pragma mark 折线图专享功能
//判断显示横线条
- (BOOL)WBLineChart:(WBLineChart *)chart ShowHorizonLineAtIndex:(NSInteger)index;
//是否显示点
- (BOOL)showPoint;
@end
在这里需要注意的是y轴的数值传的是多重数组,一个子数组里包含的数值代表一条折线的y轴数据
例如:
- (NSMutableArray *)WBLineChart_yTitleArray:(WBLineChart *)chart
{
return [NSMutableArray arrayWithArray:@[@[@"12",@"32",@"34",@"88",@"3",@"33",@"23"]]];
}
这样返回的值就是绘制一条折线的。
第二步:绘制坐标线。
1展示x轴标题(如上图的日期)
(注:代码较多,之后代码就不全部贴出来了,有需要的找我要吧。)
//numN限制x轴标题值最多只能展示7位,否则会引起label的信息展示不全或者信息重叠
NSInteger numN;
if(!self.isCompared||_xDisLabels.count>7)
{
numN=7;
}
else
numN = _xDisLabels.count;
//width标题间距
float width = (self.frame.size.width - UUYLabelwidth*3/2-UUYLabelwidth*2)/(numN-1);
//所有点之间的触摸间距,为之后做触摸屏幕中得点周围处,使对应的点展示数值以及点做动画
_touchWidth = (self.frame.size.width-UUYLabelwidth*3/2)/(_xDisLabels.count*2);
//_xDisLabelWidth所有点之间的间距,因为相邻两个标题之间可能存在多个点的情况
_xDisLabelWidth = (self.frame.size.width-UUYLabelwidth*3/2-UUYLabelwidth*2)/(numN-1);
NSInteger index2 = 0;
//设置单位lable
float height = (self.frame.size.height-UULabelHeight*2)+UULabelHeight;
UILabel * label = [[UILabel alloc] initWithFrame:CGRectMake(0, height, UUYLabelwidth+25, UULabelHeight)];
label.textColor = [UIColor whiteColor];
[label setFont:kTitle_Font_Min];
label.textAlignment = NSTextAlignmentCenter;
label.text = self.unitString;
[self addSubview:label];
_xLabelWidth = _xDisLabelWidth/ivon;
_startOrgX = index*_xLabelWidth;
//设置展示标题lable
for (int i = 0; i<numN; i++) {
NSString *labelText = xLabels[i*ivon];
float x = i * width+UUYLabelwidth*2-width/2;
if (i==0) {
x = i * _xDisLabelWidth+UUYLabelwidth;
}
UILabel * label = [[UILabel alloc] initWithFrame:CGRectMake(x, height, width, UULabelHeight)];
label.text = label.text = [labelText substringFromIndex:5];
[label setFont:[UIFont fontWithName:@"Helvetica Neue" size:12.0]];
label.textColor = [UIColor whiteColor];
label.textAlignment = NSTextAlignmentCenter;
[self addSubview:label];
}
}
代码比较多,里面主要的逻辑就是计算x轴展示的标题间距(代码中width),以及触摸距离归属(_touchWidth),所有点之间的间距(_xDisLabelWidth)。然后设置label来展示日期。其中也做了一个日期缺失的数据补全,例如:从后台获取的数据缺失了3.30这一天的数据,那么在上面的代码里面去自动补全了这个日期,并且将与之对应的值设为-1,设置成-1是为了在后面展示值是去区分真实数值和补全的假数值。
2绘制横线及y轴数值展示
绘制横线也要有个数量标准,这里展示的是6条横线,那么这6条横线所代表的数值间距是如何来定得呢?首先需要遍历出你数值数组中得最大值和最小值。
NSInteger max = 0;
NSInteger min = 1000000000;
for (NSArray * ary in yLabels) {
for (NSString *valueString in ary) {
NSInteger value = [valueString integerValue];
if (value > max) {
max = value;
}
if (value < min) {
min = value;
}
}
}
然后根据你的最大值向上取整,最小值向下取整(具体怎么取整自己根据业务展示规则定义),然后
int level = (_yValueMax-_yValueMin)/kShare;
根据获取到的取整值来计算两条横线间距所代表的差值,例如图二取到得向上取整值为400,最小值向下取整为0,那么差值就是400/5=80,这样就可以知道了y轴对应的标题组的值了,也就是{0,80,160,240,320,400}。
绘制横线
//画横线
for (int i=0; i<=kShare; i++) {
if ([_ShowHorizonLine[i] integerValue]>0) {
CAShapeLayer *shapeLayer = [CAShapeLayer layer];
UIBezierPath *path = [UIBezierPath bezierPath];
[path moveToPoint:CGPointMake(UUYLabelwidth*2,UULabelHeight+i*levelHeight)];
if (_yValues.count==2) {
[path addLineToPoint:CGPointMake(self.frame.size.width-UUYLabelwidth*3/2+15,UULabelHeight+i*levelHeight)];
}
else
{
[path addLineToPoint:CGPointMake(self.frame.size.width-UUYLabelwidth*3/2,UULabelHeight+i*levelHeight)];
}
[path closePath];
shapeLayer.path = path.CGPath;
// shapeLayer.strokeColor = [[UIColor colorWithHexString:@"#2d3e66"] CGColor];
if (i==0) {
shapeLayer.strokeColor = [[UIColor colorWithHexString:@"#257ca2" alpha:1] CGColor];
}
else if (i==5)
{
shapeLayer.strokeColor = [[UIColor colorWithHexString:@"#257ca2" alpha:1] CGColor];
}
else
{
shapeLayer.strokeColor = [[UIColor colorWithHexString:@"#3BC3FF" alpha:0.2] CGColor];
}
shapeLayer.fillColor = [[UIColor clearColor] CGColor];
shapeLayer.lineWidth = 1.0;
[self.layer addSublayer:shapeLayer];
}
}
第3步绘制折线
现在横线及x、y轴的标题都写好了,那么就开始绘制折线了,这里就只介绍怎么绘制多点折线,具体在项目中怎么写,开发者要自己去计算坐标以及运用。
CAShapeLayer *_chartLine = [CAShapeLayer layer];
_chartLine.lineCap = kCALineCapSquare;
_chartLine.lineJoin = kCALineJoinBevel;
//设置虚线
_chartLine.lineDashPattern = [NSArray arrayWithObjects:@4,@2, nil];
_chartLine.fillColor = [[UIColor clearColor] CGColor];
_chartLine.lineWidth = 1;
_chartLine.strokeEnd = 0.0;
[self.layer addSublayer:_chartLine];
UIBezierPath *progressline = [UIBezierPath bezierPath];
[progressline setLineWidth:2.0];
[progressline setLineCapStyle:kCGLineCapRound];
[progressline setLineJoinStyle:kCGLineJoinRound];
[progressline moveToPoint:CGPointMake(xPosition, yPosition)];
这里的xPostion和yPosition就是第一个数值计算出来的在坐标中得x和y值,
然后写一个循环去遍历数值数组去计算每个点的位置,两点间连线
[progressline addLineToPoint:point2];
[progressline moveToPoint:point2];
加上折线的绘制动画
CABasicAnimation *pathAnimation = [CABasicAnimation animationWithKeyPath:@"strokeEnd"];
pathAnimation.duration = 2.0;
pathAnimation.timingFunction = [CAMediaTimingFunction functionWithName:kCAMediaTimingFunctionEaseInEaseOut];
pathAnimation.fromValue = [NSNumber numberWithFloat:0.0f];
pathAnimation.toValue = [NSNumber numberWithFloat:1.0f];
pathAnimation.autoreverses = NO;
[_chartLine addAnimation:pathAnimation forKey:@"strokeEndAnimation"];
_chartLine.strokeEnd = 1.0;
第4步:绘制阴影
在drawRect方法中调用下面绘制阴影的方法即可。具体讲解看方法中得注释。
#pragma mark-阴影部分绘制
/**
* 阴影部分绘制
*
* @param rect 参数rect
* @param arr 要绘制的点得数组
*/
-(void)drawYingyinRect:(CGRect)rect withPoints:(NSArray*)arr index:(NSInteger)index
{
if (!arr || [arr count]<=0) return;
CGContextRef context = UIGraphicsGetCurrentContext();
CGContextSaveGState(context);
{
//先画出要裁剪的区域
CGPoint firstPoint = [[arr objectAtIndex:0] CGPointValue];
CGContextMoveToPoint(context, firstPoint.x, self.frame.size.height);
CGContextSetLineWidth(context, 2);
for (int i=0; i<[arr count]; i++) {
//画中间的区域
CGPoint point = [[arr objectAtIndex:i] CGPointValue];
CGContextAddLineToPoint(context, point.x, point.y);
}
CGPoint lastPoint = [[arr objectAtIndex:([arr count]-1)] CGPointValue];
{
//画边框
CGContextAddLineToPoint(context, lastPoint.x, self.frame.size.height);
CGContextAddLineToPoint(context, self.frame.size.width, self.frame.size.height);
CGContextAddLineToPoint(context, self.frame.size.width, 0);
CGContextAddLineToPoint(context, 0, 0);
CGContextAddLineToPoint(context, 0, self.frame.size.height);
}
CGContextClosePath(context);
CGContextAddRect(context, CGContextGetClipBoundingBox(context));
CGContextEOClip(context);
//裁剪
CGContextMoveToPoint(context, firstPoint.x, 0);
CGContextAddLineToPoint(context, firstPoint.x, (self.frame.size.height-UULabelHeight*2)+UULabelHeight);
CGContextSetLineWidth(context,self.frame.size.width*2);
CGContextReplacePathWithStrokedPath(context);
CGContextClip(context);
//填充渐变
CGColorSpaceRef rgb = CGColorSpaceCreateDeviceRGB();
if (index == 0) {
CGFloat colors[] = {
68/255.0,192/255.0,254/255.0,0.6,
68/255.0,192/255.0,254/255.0,0.0,
68/255.0,192/255.0,254/255.0,0.0
};
CGGradientRef gradient = CGGradientCreateWithColorComponents(rgb, colors, NULL, 2);
CGContextDrawLinearGradient(context, gradient, CGPointMake(firstPoint.x, 0), CGPointMake(firstPoint.x, self.frame.size.height), 0);
CGGradientRelease(gradient);
}
else
{
CGFloat colors[] = {
239/255.0,0/255.0,180/255.0,0.6,
239/255.0,0/255.0,180/255.0,0.0,
239/255.0,0/255.0,180/255.0,0.0
};
CGGradientRef gradient = CGGradientCreateWithColorComponents(rgb, colors, NULL, 2);
CGContextDrawLinearGradient(context, gradient, CGPointMake(firstPoint.x, 0), CGPointMake(firstPoint.x, self.frame.size.height), 0);
CGGradientRelease(gradient);
}
}
CGContextRestoreGState(context);
}
第5步 处理点击及随手指移动展现对应范围内的点数据
也就是根据手势触发的点得位置来确定其属于哪段横坐标对应的范围,然后使之对应的点展现水波纹的动效并且展示对应的数据。
只要复写UIResponder的两个手势回调的方法,然后进行判断处理即可。
-(void)touchesMoved:(NSSet<UITouch *> *)touches withEvent:(UIEvent *)event
{
[self handleTouches:touches withEvent:event];
}
-(void)touchesBegan:(NSSet *)touches withEvent:(UIEvent *)event
{
[self handleTouches:touches withEvent:event];
}
/**
* 点击事件处理
*
* @param touches
* @param event
*/
-(void)handleTouches:(NSSet *)touches withEvent:(UIEvent *)event
{
UITouch *touch = [touches anyObject];
//取得手势触发点得位置
CGPoint point = [touch locationInView:self];
//遍历点得位置,然后取两点x轴的差值的绝对值,如果小于点触摸范围,即可展示这个点
for (WBImageView *img in self.imgArr) {
CGPoint tempPoint = img.center;
if (fabs(point.x-tempPoint.x)<_touchWidth) {
[self showPoint:img];
break;
}
}
}
具体的展现在showPoint:方法中,这里就不贴代码了,可以根据自己的需求去写。
图1:单折线图
图2:双折线图
下面开始介绍如何绘制折线图,达到以上的效果。
第一步:数据源传递
折线图是根据app中的具体的数据来绘制的,其中包括了横坐标数据源、纵坐标数据源、单位、折线颜色值等等。
为了更好得解耦以及传值,我们选用代理的方式来传值。
在.h文件中声明个协议及协议的方法。
@protocol WBLineChartDataSource <NSObject>
@required
//横坐标标题数组
- (NSMutableArray *)WBLineChart_xTitleArray:(WBLineChart *)chart;
//数值多重数组
- (NSMutableArray *)WBLineChart_yTitleArray:(WBLineChart *)chart;
@optional
//颜色数组
- (NSMutableArray *)WBLineChart_colorArray:(WBLineChart *)chart;
//显示数值范围
- (CGRange)WBLineChartRangeOfYValue:(WBLineChart *)chart;
#pragma mark 折线图专享功能
//判断显示横线条
- (BOOL)WBLineChart:(WBLineChart *)chart ShowHorizonLineAtIndex:(NSInteger)index;
//是否显示点
- (BOOL)showPoint;
@end
在这里需要注意的是y轴的数值传的是多重数组,一个子数组里包含的数值代表一条折线的y轴数据
例如:
- (NSMutableArray *)WBLineChart_yTitleArray:(WBLineChart *)chart
{
return [NSMutableArray arrayWithArray:@[@[@"12",@"32",@"34",@"88",@"3",@"33",@"23"]]];
}
这样返回的值就是绘制一条折线的。
第二步:绘制坐标线。
1展示x轴标题(如上图的日期)
(注:代码较多,之后代码就不全部贴出来了,有需要的找我要吧。)
//numN限制x轴标题值最多只能展示7位,否则会引起label的信息展示不全或者信息重叠
NSInteger numN;
if(!self.isCompared||_xDisLabels.count>7)
{
numN=7;
}
else
numN = _xDisLabels.count;
//width标题间距
float width = (self.frame.size.width - UUYLabelwidth*3/2-UUYLabelwidth*2)/(numN-1);
//所有点之间的触摸间距,为之后做触摸屏幕中得点周围处,使对应的点展示数值以及点做动画
_touchWidth = (self.frame.size.width-UUYLabelwidth*3/2)/(_xDisLabels.count*2);
//_xDisLabelWidth所有点之间的间距,因为相邻两个标题之间可能存在多个点的情况
_xDisLabelWidth = (self.frame.size.width-UUYLabelwidth*3/2-UUYLabelwidth*2)/(numN-1);
NSInteger index2 = 0;
//设置单位lable
float height = (self.frame.size.height-UULabelHeight*2)+UULabelHeight;
UILabel * label = [[UILabel alloc] initWithFrame:CGRectMake(0, height, UUYLabelwidth+25, UULabelHeight)];
label.textColor = [UIColor whiteColor];
[label setFont:kTitle_Font_Min];
label.textAlignment = NSTextAlignmentCenter;
label.text = self.unitString;
[self addSubview:label];
_xLabelWidth = _xDisLabelWidth/ivon;
_startOrgX = index*_xLabelWidth;
//设置展示标题lable
for (int i = 0; i<numN; i++) {
NSString *labelText = xLabels[i*ivon];
float x = i * width+UUYLabelwidth*2-width/2;
if (i==0) {
x = i * _xDisLabelWidth+UUYLabelwidth;
}
UILabel * label = [[UILabel alloc] initWithFrame:CGRectMake(x, height, width, UULabelHeight)];
label.text = label.text = [labelText substringFromIndex:5];
[label setFont:[UIFont fontWithName:@"Helvetica Neue" size:12.0]];
label.textColor = [UIColor whiteColor];
label.textAlignment = NSTextAlignmentCenter;
[self addSubview:label];
}
}
代码比较多,里面主要的逻辑就是计算x轴展示的标题间距(代码中width),以及触摸距离归属(_touchWidth),所有点之间的间距(_xDisLabelWidth)。然后设置label来展示日期。其中也做了一个日期缺失的数据补全,例如:从后台获取的数据缺失了3.30这一天的数据,那么在上面的代码里面去自动补全了这个日期,并且将与之对应的值设为-1,设置成-1是为了在后面展示值是去区分真实数值和补全的假数值。
2绘制横线及y轴数值展示
绘制横线也要有个数量标准,这里展示的是6条横线,那么这6条横线所代表的数值间距是如何来定得呢?首先需要遍历出你数值数组中得最大值和最小值。
NSInteger max = 0;
NSInteger min = 1000000000;
for (NSArray * ary in yLabels) {
for (NSString *valueString in ary) {
NSInteger value = [valueString integerValue];
if (value > max) {
max = value;
}
if (value < min) {
min = value;
}
}
}
然后根据你的最大值向上取整,最小值向下取整(具体怎么取整自己根据业务展示规则定义),然后
int level = (_yValueMax-_yValueMin)/kShare;
根据获取到的取整值来计算两条横线间距所代表的差值,例如图二取到得向上取整值为400,最小值向下取整为0,那么差值就是400/5=80,这样就可以知道了y轴对应的标题组的值了,也就是{0,80,160,240,320,400}。
绘制横线
//画横线
for (int i=0; i<=kShare; i++) {
if ([_ShowHorizonLine[i] integerValue]>0) {
CAShapeLayer *shapeLayer = [CAShapeLayer layer];
UIBezierPath *path = [UIBezierPath bezierPath];
[path moveToPoint:CGPointMake(UUYLabelwidth*2,UULabelHeight+i*levelHeight)];
if (_yValues.count==2) {
[path addLineToPoint:CGPointMake(self.frame.size.width-UUYLabelwidth*3/2+15,UULabelHeight+i*levelHeight)];
}
else
{
[path addLineToPoint:CGPointMake(self.frame.size.width-UUYLabelwidth*3/2,UULabelHeight+i*levelHeight)];
}
[path closePath];
shapeLayer.path = path.CGPath;
// shapeLayer.strokeColor = [[UIColor colorWithHexString:@"#2d3e66"] CGColor];
if (i==0) {
shapeLayer.strokeColor = [[UIColor colorWithHexString:@"#257ca2" alpha:1] CGColor];
}
else if (i==5)
{
shapeLayer.strokeColor = [[UIColor colorWithHexString:@"#257ca2" alpha:1] CGColor];
}
else
{
shapeLayer.strokeColor = [[UIColor colorWithHexString:@"#3BC3FF" alpha:0.2] CGColor];
}
shapeLayer.fillColor = [[UIColor clearColor] CGColor];
shapeLayer.lineWidth = 1.0;
[self.layer addSublayer:shapeLayer];
}
}
第3步绘制折线
现在横线及x、y轴的标题都写好了,那么就开始绘制折线了,这里就只介绍怎么绘制多点折线,具体在项目中怎么写,开发者要自己去计算坐标以及运用。
CAShapeLayer *_chartLine = [CAShapeLayer layer];
_chartLine.lineCap = kCALineCapSquare;
_chartLine.lineJoin = kCALineJoinBevel;
//设置虚线
_chartLine.lineDashPattern = [NSArray arrayWithObjects:@4,@2, nil];
_chartLine.fillColor = [[UIColor clearColor] CGColor];
_chartLine.lineWidth = 1;
_chartLine.strokeEnd = 0.0;
[self.layer addSublayer:_chartLine];
UIBezierPath *progressline = [UIBezierPath bezierPath];
[progressline setLineWidth:2.0];
[progressline setLineCapStyle:kCGLineCapRound];
[progressline setLineJoinStyle:kCGLineJoinRound];
[progressline moveToPoint:CGPointMake(xPosition, yPosition)];
这里的xPostion和yPosition就是第一个数值计算出来的在坐标中得x和y值,
然后写一个循环去遍历数值数组去计算每个点的位置,两点间连线
[progressline addLineToPoint:point2];
[progressline moveToPoint:point2];
加上折线的绘制动画
CABasicAnimation *pathAnimation = [CABasicAnimation animationWithKeyPath:@"strokeEnd"];
pathAnimation.duration = 2.0;
pathAnimation.timingFunction = [CAMediaTimingFunction functionWithName:kCAMediaTimingFunctionEaseInEaseOut];
pathAnimation.fromValue = [NSNumber numberWithFloat:0.0f];
pathAnimation.toValue = [NSNumber numberWithFloat:1.0f];
pathAnimation.autoreverses = NO;
[_chartLine addAnimation:pathAnimation forKey:@"strokeEndAnimation"];
_chartLine.strokeEnd = 1.0;
第4步:绘制阴影
在drawRect方法中调用下面绘制阴影的方法即可。具体讲解看方法中得注释。
#pragma mark-阴影部分绘制
/**
* 阴影部分绘制
*
* @param rect 参数rect
* @param arr 要绘制的点得数组
*/
-(void)drawYingyinRect:(CGRect)rect withPoints:(NSArray*)arr index:(NSInteger)index
{
if (!arr || [arr count]<=0) return;
CGContextRef context = UIGraphicsGetCurrentContext();
CGContextSaveGState(context);
{
//先画出要裁剪的区域
CGPoint firstPoint = [[arr objectAtIndex:0] CGPointValue];
CGContextMoveToPoint(context, firstPoint.x, self.frame.size.height);
CGContextSetLineWidth(context, 2);
for (int i=0; i<[arr count]; i++) {
//画中间的区域
CGPoint point = [[arr objectAtIndex:i] CGPointValue];
CGContextAddLineToPoint(context, point.x, point.y);
}
CGPoint lastPoint = [[arr objectAtIndex:([arr count]-1)] CGPointValue];
{
//画边框
CGContextAddLineToPoint(context, lastPoint.x, self.frame.size.height);
CGContextAddLineToPoint(context, self.frame.size.width, self.frame.size.height);
CGContextAddLineToPoint(context, self.frame.size.width, 0);
CGContextAddLineToPoint(context, 0, 0);
CGContextAddLineToPoint(context, 0, self.frame.size.height);
}
CGContextClosePath(context);
CGContextAddRect(context, CGContextGetClipBoundingBox(context));
CGContextEOClip(context);
//裁剪
CGContextMoveToPoint(context, firstPoint.x, 0);
CGContextAddLineToPoint(context, firstPoint.x, (self.frame.size.height-UULabelHeight*2)+UULabelHeight);
CGContextSetLineWidth(context,self.frame.size.width*2);
CGContextReplacePathWithStrokedPath(context);
CGContextClip(context);
//填充渐变
CGColorSpaceRef rgb = CGColorSpaceCreateDeviceRGB();
if (index == 0) {
CGFloat colors[] = {
68/255.0,192/255.0,254/255.0,0.6,
68/255.0,192/255.0,254/255.0,0.0,
68/255.0,192/255.0,254/255.0,0.0
};
CGGradientRef gradient = CGGradientCreateWithColorComponents(rgb, colors, NULL, 2);
CGContextDrawLinearGradient(context, gradient, CGPointMake(firstPoint.x, 0), CGPointMake(firstPoint.x, self.frame.size.height), 0);
CGGradientRelease(gradient);
}
else
{
CGFloat colors[] = {
239/255.0,0/255.0,180/255.0,0.6,
239/255.0,0/255.0,180/255.0,0.0,
239/255.0,0/255.0,180/255.0,0.0
};
CGGradientRef gradient = CGGradientCreateWithColorComponents(rgb, colors, NULL, 2);
CGContextDrawLinearGradient(context, gradient, CGPointMake(firstPoint.x, 0), CGPointMake(firstPoint.x, self.frame.size.height), 0);
CGGradientRelease(gradient);
}
}
CGContextRestoreGState(context);
}
第5步 处理点击及随手指移动展现对应范围内的点数据
也就是根据手势触发的点得位置来确定其属于哪段横坐标对应的范围,然后使之对应的点展现水波纹的动效并且展示对应的数据。
只要复写UIResponder的两个手势回调的方法,然后进行判断处理即可。
-(void)touchesMoved:(NSSet<UITouch *> *)touches withEvent:(UIEvent *)event
{
[self handleTouches:touches withEvent:event];
}
-(void)touchesBegan:(NSSet *)touches withEvent:(UIEvent *)event
{
[self handleTouches:touches withEvent:event];
}
/**
* 点击事件处理
*
* @param touches
* @param event
*/
-(void)handleTouches:(NSSet *)touches withEvent:(UIEvent *)event
{
UITouch *touch = [touches anyObject];
//取得手势触发点得位置
CGPoint point = [touch locationInView:self];
//遍历点得位置,然后取两点x轴的差值的绝对值,如果小于点触摸范围,即可展示这个点
for (WBImageView *img in self.imgArr) {
CGPoint tempPoint = img.center;
if (fabs(point.x-tempPoint.x)<_touchWidth) {
[self showPoint:img];
break;
}
}
}
具体的展现在showPoint:方法中,这里就不贴代码了,可以根据自己的需求去写。

相关文章推荐
- iOS开发之路--微博“更多”页面
- iOS开发之路--微博骨架搭建
- iOS开发使用JSON解析网络数据
- IOS开发代码分享之获取启动画面图片的string
- iOS开发实现音频播放功能
- iOS开发使用XML解析网络数据
- IOS开发实现录音功能
- IOS开发之路--C语言数组和字符串
- IOS开发代码分享之用nstimer实现倒计时功能
- iOS开发使用GDataXML框架解析网络数据
- IOS开发代码分享之设置UISearchBar的背景颜色
- ios推送证书
- iOS和tvOS游戏按需加载资源简介
- ios开发之环境搭建-01
- 在开发iOS程序时对日期处理的总结
- iOS开发——keychain的使用
- iOS Graphics Technologies iOS 图形技术
- iOS开发异常错误总结
- 学习Objective-C:入门手册