logstash+elastic+kibana日志管理工具介绍及安装
2016-03-24 17:47
483 查看
logstash+elastic+kibana日志管理工具介绍及安装
一、 Logstash 安装
1.1 前置条件,安装了官方java 7或更新版本查看
[ldx@1511-min ~]$ java -version
openjdk version "1.8.0_71"
OpenJDK Runtime Environment (build 1.8.0_71-b15)
OpenJDK 64-Bit Server VM (build 25.71-b15, mixed mode)
1.2 在官网下载适合环境的logstash安装包
此处我选择rpm包方式 网址:
https://download.elastic.co/logstash/logstash/packages/centos/logstash-2.2.2-1.noarch.rpm
yum 安装方式
导入公钥
rpm –import https://packages.elastic.co/GPG-KEY-elasticsearch
配置源,新建文件并编辑/etc/yum.repos.d/logstash.repo
[logstash-2.2]
name=Logstash repository for 2.2.x packages
baseurl=http://packages.elastic.co/logstash/2.2/centos
gpgcheck=1
gpgkey=http://packages.elastic.co/GPG-KEY-elasticsearch
enabled=1
安装
yum install logstash
装好后测试
我的默认路径是/opt/logstash
[root@1511-min logstash]# bin/logstash -e ‘input { stdin { } } output { stdout {} }’
Settings: Default pipeline workers: 2
hello fronware
Logstash startup completed
2016-02-23T02:53:41.767Z 0.0.0.0 hello fronware
1.3 编写配置文件输出到Elasticsearch
input {
file {
path => "/tmp/access_log"
start_position => "beginning"
}
}

filter {
if [path] =~ "access" {
mutate { replace => { "type" => "apache_access" } }
grok {
match => { "message" => "%{COMBINEDAPACHELOG}" }
}
}
date {
match => [ "timestamp" , "dd/MMM/yyyy:HH:mm:ss Z" ]
}
}

output {
elasticsearch {
hosts => ["localhost:9200"]
}
stdout { codec => rubydebug }
}
二、Elasticsearch
2.1 基本概念There are a few concepts that are core to Elasticsearch. Understanding these concepts from the outset
4000
will tremendously help ease the learning process.
Near Realtime (NRT)
Elasticsearch是一个接近实时的搜索平台。这意味着,从索引一个文档直到这个文档能够被搜索到有一个轻微的延迟(通常是1秒)
Cluster
一个集群就是由一个或多个节点组织在一起,它们共同持有你整个的数据,并一起提供索引和搜索功能。一个集群由一个唯一的名字标识,这个名字默认就是 “elasticsearch”。这个名字是重要的,因为一个节点只能通过指定某个集群的名字,来加入这个集群。在产品环境中显式地设定这个名字是一个好 习惯,但是使用默认值来进行测试/开发也是不错的。
Node
一个节点是你集群中的一个服务器,作为集群的一部分,它存储你的数据,参与集群的索引和搜索功能。和集群类似,一个节点也是由一个名字来标识的,默认情况 下,这个名字是一个随机的漫威漫画角色的名字,这个名字会在启动的时候赋予节点。这个名字对于管理工作来说挺重要的,因为在这个管理过程中,你会去确定网 络中的哪些服务器对应于Elasticsearch集群中的哪些节点。
一个节点可以通过配置集群名称的方式来加入一个指定的集群。默认情况下,每个节点都会被安排加入到一个叫做“elasticsearch”的集群中,这意 味着,如果你在你的网络中启动了若干个节点,并假定它们能够相互发现彼此,它们将会自动地形成并加入到一个叫做“elasticsearch”的集群中。
在一个集群里,只要你想,可以拥有任意多个节点。而且,如果当前你的网络中没有运行任何Elasticsearch节点,这时启动一个节点,会默认创建并加入一个叫做“elasticsearch”的集群。
Index
一个索引就是一个拥有几分相似特征的文档的集合。比如说,你可以有一个客户数据的索引,另一个产品目录的索引,还有一个订单数据的索引。一个索引由一个名 字来标识(必须全部是小写字母的),并且当我们要对对应于这个索引中的文档进行索引、搜索、更新和删除的时候,都要使用到这个名字。
在一个集群中,如果你想,可以定义任意多的索引。
Type
在一个索引中,你可以定义一种或多种类型。一个类型是你的索引的一个逻辑上的分类/分区,其语义完全由你来定。通常,会为具有一组共同字段的文档定义一个类型。比如说,我们假设你运营一个博客平台并且将你所有的数据存储到一个索引中。在这个索引中,你可以为用户数据定义一个类型,为博客数据定义另一个类型,当然,也可以为评论数据定义另一个类型。
Document
一个文档是一个可被索引的基础信息单元。比如,你可以拥有某一个客户的文档,某一个产品的一个文档,当然,也可以拥有某个订单的一个文档。文档以 JSON(Javascript Object Notation)格式来表示,而JSON是一个到处存在的互联网数据交互格式。
在一个index/type里面,只要你想,你可以存储任意多的文档。注意,尽管一个文档物理上存在于一个索引之中,文档必须被索引/赋予一个索引的type。
Shards & Replicas
一个索引可以存储超出单个结点硬件限制的大量数据。比如,一个具有10亿文档的索引占据1TB的磁盘空间,而任一节点都没有这样大的磁盘空间;或者单个节点处理搜索请求,响应太慢。
为了解决这个问题,Elasticsearch提供了将索引划分成多份的能力,这些份就叫做分片。当你创建一个索引的时候,你可以指定你想要的分片的数量。每个分片本身也是一个功能完善并且独立的“索引”,这个“索引”可以被放置到集群中的任何节点上。
分片之所以重要,主要有两方面的原因:
- 允许你水平分割/扩展你的内容容量
- 允许你在分片(潜在地,位于多个节点上)之上进行分布式的、并行的操作,进而提高性能/吞吐量
至于一个分片怎样分布,它的文档怎样聚合回搜索请求,是完全由Elasticsearch管理的,对于作为用户的你来说,这些都是透明的。
在一个网络/云的环境里,失败随时都可能发生,在某个分片/节点不知怎么的就处于离线状态,或者由于任何原因消失了,这种情况下,有一个故障转移机制是非 常有用并且是强烈推荐的。为此目的,Elasticsearch允许你创建分片的一份或多份拷贝,这些拷贝叫做复制分片,或者直接叫复制。
复制之所以重要,有两个主要原因:
- 在分片/节点失败的情况下,提供了高可用性。因为这个原因,注意到复制分片从不与原/主要(original/primary)分片置于同一节点上是非常重要的。
- 扩展你的搜索量/吞吐量,因为搜索可以在所有的复制上并行运行
总之,每个索引可以被分成多个分片。一个索引也可以被复制0次(意思是没有复制)或多次。一旦复制了,每个索引就有了主分片(作为复制源的原来的分片)和复制分片(主分片的拷贝)之别。分片和复制的数量可以在索引创建的时候指定。在索引创建之后,你可以在任何时候动态地改变复制的数量,但是你事后不能改变分片的数量。
默认情况下,Elasticsearch中的每个索引被分片5个主分片和1个复制,这意味着,如果你的集群中至少有两个节点,你的索引将会有5个主分片和另外5个复制分片(1个完全拷贝),这样的话每个索引总共就有10个分片。
Each Elasticsearch shard is a Lucene index. There is a maximum number of documents you can have in a single Lucene index. As of LUCENE-5843, the limit is 2,147,483,519 (= Integer.MAX_VALUE - 128) documents. You can monitor shard sizes using the _cat/shards api.
2.2 Elasticsearch 安装
不与logstash,kibana区分安装顺序,一样需要java
安装方式与logstash差不多
wget
https://download.elasticsearch.org/elasticsearch/release/org/elasticsearch/distribution/rpm/elasticsearch/2.2.0/elasticsearch-2.2.0.rpm
或者
yum 安装方式
导入公钥
rpm –import https://packages.elastic.co/GPG-KEY-elasticsearch
配置源,新建文件并编辑/etc/yum.repos.d/elasticsearch.repo
[elasticsearch-2.x]
name=Elasticsearch repository for 2.x packages
baseurl=http://packages.elastic.co/elasticsearch/2.x/centos
gpgcheck=1
gpgkey=http://packages.elastic.co/GPG-KEY-elasticsearch
enabled=1
安装
yum install elasticsearch
或
curl -L -O https://download.elastic.co/elasticsearch/release/org/elasticsearch/distribution/tar/elasticsearch/2.2.0/elasticsearch-2.2.0.tar.gz
tar -xvf elasticsearch-2.2.0.tar.gz
cd elasticsearch-2.2.0/bin
./elasticsearch
如果一切顺利,你将看到大量的如下信息:
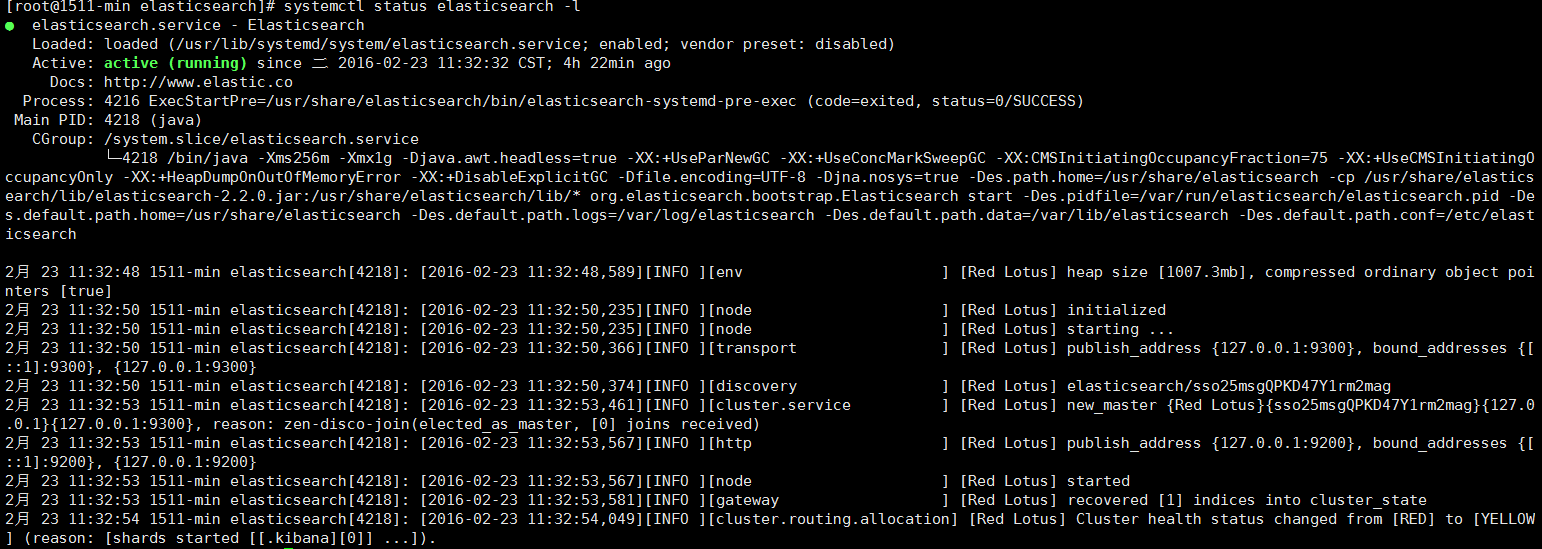
不去涉及太多细节,我们可以看到,一叫做“Red Lotus”(你会见到一个不同的漫威漫画角色)的节点启动并且将自己选做单结点集群的master。现在不用关心master是什么东西。这里重要的就是,我们在一个集群中开启了一个节点
正如先前提到的,我们可以覆盖集群或者节点的名字。我们可以在启动Elasticsearch的时候通过命令行来指定,如下:
./elasticsearch –cluster.name my_cluster_name –node.name my_node_name
也要注意一下有http标记的那一行,它提供了有关HTTP地址(127.0.0.1)和端口(9200)的信息,通过这个地址和端口我们就可以 访问我们的节点了。默认情况下,Elasticsearch使用9200来提供对其REST API的访问。如果有必要,这个端口是可以配置的。
现在让我们创建一个叫做“customer”的索引,然后再列出所有的索引:
[root@1511-min elasticsearch]# curl -XPUT 'localhost:9200/customer?pretty'
{
"acknowledged" : true
}
[root@1511-min elasticsearch]# curl 'localhost:9200/_cat/indices?v'
health status index    pri rep docs.count docs.deleted store.size pri.store.size
yellow open   .kibana    1   1  1          0      3.1kb          3.1kb
yellow open   customer   5   1     0      0       650b           650b
第一个命令使用PUT创建了一个叫做“customer”的索引。我们简单地将pretty附加到调用的尾部,使其以美观的形式打印出JSON响应(如果有的话)
第二个命令的结果告知我们,我们现在有一个叫做customer的索引,并且它有5个主分片和1份复制(都是默认值),其中包含0个文档。
2.3 索引并查询一个文档
现在让我们放一些东西到customer索引中。首先要知道的是,为了索引一个文档,我们必须告诉Elasticsearch这个文档要到这个索引的哪个类型(type)下。
让我们将一个简单的客户文档索引到customer索引、“external”类型中,这个文档的ID是1,操作如下:
[root@15-min elasticsearch]#curl-XPUT localhost:9200/customer/external/1?pretty’
–d ‘{ “name”:”John Doe”}’
响应如下:
{
"_index" : "customer",
"_type" : "external",
"_id" : "1",
"_version" : 1,
"_shards" : {
"total" : 2,
"successful" : 1,
"failed" : 0
},
"created" : true
}
从上面的响应中,我们可以看到,一个新的客户文档在customer索引和external类型中被成功创建。文档也有一个内部id 1, 这个id是我们在索引的时候指定的。
有一个关键点需要注意,Elasticsearch在你想将文档索引到某个索引的时候,并不强制要求这个索引被显式地创建。在前面这个例子中,如果customer索引不存在,Elasticsearch将会自动地创建这个索引。
现在,让我们把刚刚索引的文档取出来:
[root@15-min elasticsearch]#curl -XGET ‘localhost:9200/customer/external/1?pretty’
响应如下:
{
"_index" : "customer",
"_type" : "external",
"_id" : "1",
"_version" : 1,
"found" : true,
"_source" : {
"name" : "John Doe"
}
}
除了一个叫做found的字段来指明我们找到了一个ID为1的文档,和另外一个字段——_source——返回我们前一步中索引的完整JSON文档之外,其它的都没有什么特别之处。
2.4 删除一个索引
现在让我们删除我们刚刚创建的索引,并再次列出所有的索引:
[root@1511-min elasticsearch]#  curl -XGET 'localhost:9200/customer/external/1?pretty'
{
"_index" : "customer",
"_type" : "external",
"_id" : "1",
"_version" : 1,
"found" : true,
"_source" : {
"name" : "John Doe"
}
}
[root@1511-min elasticsearch]# curl -XDELETE 'localhost:9200/customer?pretty'
{
"acknowledged" : true
}
[root@1511-min elasticsearch]# curl 'localhost:9200/_cat/indices?v'
health status index   pri rep docs.count docs.deleted store.size pri.store.size
yellow open   .kibana   1   1     1         0      3.1kb          3.1kb
如果我们仔细研究以上的命令,我们可以发现访问Elasticsearch中数据的一个模式。这个模式可以被总结为:
curl -X :///
这个REST访问模式普遍适用于所有的API命令,如果你能记住它,你就会为掌握Elasticsearch开一个好头。
2.5 修改数据
Elasticsearch提供了近乎实时的数据操作和搜索功能。默认情况下,从你索引/更新/删除你的数据动作开始到它出现在你的搜索结果中,大概会有1秒钟的延迟。这和其它类似SQL的平台不同,数据在一个事务完成之后
aecd
就会立即可用。
我们先前看到,怎样索引一个文档。现在我们再次调用那个命令:
curl -XPUT 'localhost:9200/customer/external/1?pretty' -d '{"name": "John Doe"}'
{
"_index" : "customer",
"_type" : "external",
"_id" : "1",
"_version" : 1,
"_shards" : {
"total" : 2,
"successful" : 1,
"failed" : 0
},
"created" : true
}
curl -XGET 'localhost:9200/customer/external/1?pretty'
{
"_index" : "customer",
"_type" : "external",
"_id" : "1",
"_version" : 1,
"found" : true,
"_source" : {
"name" : "John Doe"
}
}
curl -XPUT 'localhost:9200/customer/external/1?pretty' -d '{ "name":"Jane Doe"}'
{
"_index" : "customer",
"_type" : "external",
"_id" : "1",
"_version" : 2,
"_shards" : {
"total" : 2,
"successful" : 1,
"failed" : 0
},
"created" : false
}
curl -XGET 'localhost:9200/customer/external/1?pretty'
{
"_index" : "customer",
"_type" : "external",
"_id" : "1",
"_version" : 2,
"found" : true,
"_source" : {
"name" : "Jane Doe"
}
}
再次,以上的命令将会把这个文档索引到customer索引、external类型中,其ID是1。如果我们对一个不同(或相同)的文档应用以上的命令,Elasticsearch将会用一个新的文档来替换(重新索引)当前ID为1的那个文档。
以上的命令将ID为1的文档的name字段的值从“John Doe”改成了“Jane Doe”。如果我们使用一个不同的ID,一个新的文档将会被索引,当前已经在索引中的文档不会受到影响。
在索引的时候,ID部分是可选的。如果不指定,Elasticsearch将产生一个随机的ID来索引这个文档。Elasticsearch生成的ID会作为索引API调用的一部分被返回。
curl -XPOST 'localhost:9200/customer/external?pretty' -d '{ "name":"opd rwe"}'
{
"_index" : "customer",
"_type" : "external",
"_id" : "AVMNbIVkl9iom54Ggw__",
"_version" : 1,
"_shards" : {
"total" : 2,
"successful" : 1,
"failed" : 0
},
"created" : true
}
注意,在上面的情形中,由于我们没有指定一个ID,我们使用的是POST而不是PUT。
三、 Kibana 安装
You can set up Kibana and start exploring your Elasticsearch indices in minutes. All you need is:• Elasticsearch 2.2 or later
• A modern web browser - Supported Browsers.
• Information about your Elasticsearch installation:
o URL of the Elasticsearch instance you want to connect to.
o Which Elasticsearch indices you want to search.
If your Elasticsearch installation is protected by Shield see Shield with Kibana 4 for additional setup instructions.
开始安装
To get Kibana up and running:
1. Download the Kibana 4 binary package for your platform.
2. Extract the .zip or tar.gz archive file.
On Unix, you can instead run the package manager suited for your distribution.
Kibana 仓库
Binary packages for Kibana are available for Unix distributions that support the apt and yum tools.We also have repositories available for APT and YUM based distributions.
Since the packages are created as part of the Kibana build, source packages are not available.
Packages are signed with the PGP key D88E42B4, which has the following fingerprint:
4609 5ACC 8548 582C 1A26 99A9 D27D 666C D88E 42B4
Installing Kibana with yum
The repositories set up in this procedure are not compatible with distributions using version 3 of rpm, such as CentOS version 5.
1. Download and install the public signing key:
rpm –import https://packages.elastic.co/GPG-KEY-elasticsearch
2. Create a file named kibana.repo in the /etc/yum.repos.d/ directory with the following contents:
[kibana-4.4]
name=Kibana repository for 4.4.x packages
baseurl=http://packages.elastic.co/kibana/4.4/centos
gpgcheck=1
gpgkey=http://packages.elastic.co/GPG-KEY-elasticsearch
enabled=1
3.•Install Kibana by running the following command:
yum install kibana
Configure Kibana to automatically start during bootup. If your distribution is using the System V version of init, run the following command:
chkconfig –add kibana
3. If your distribution is using systemd, run the following commands instead:
sudo /bin/systemctl daemon-reload
sudo /bin/systemctl enable kibana.service
After installing, run Kibana from the install directory: bin/kibana (Linux/MacOSX) or bin\kibana.bat (Windows).
That’s it! Kibana is now running on port 5601.
* Kibana and Elasticsearch Dynamic Mapping*
By default, Elasticsearch enables dynamic mapping for fields. Kibana needs dynamic mapping to use fields in visualizations correctly, as well as to manage the .kibana index where saved searches, visualizations, and dashboards are stored.
If your Elasticsearch use case requires you to disable dynamic mapping, you need to manually provide mappings for fields that Kibana uses to create visualizations. You also need to manually enable dynamic mapping for the .kibana index.
The following procedure assumes that the .kibana index does not already exist in Elasticsearch and that the index.mapper.dynamic setting in elasticsearch.yml is set to false:
1. Start Elasticsearch.
2. Create the .kibana index with dynamic mapping enabled just for that index:
PUT .kibana
{
“index.mapper.dynamic”: true
}
3. Start Kibana and navigate to the web UI and verify that there are no error messages related to dynamic mapping.
Connect Kibana with Elasticsearch
Before you can start using Kibana, you need to tell it which Elasticsearch indices you want to explore. The first time you access Kibana, you are prompted to define an index pattern that matches the name of one or more of your indices. That’s it. That’s all you need to configure to start using Kibana. You can add index patterns at any time from the Settings tab.
By default, Kibana connects to the Elasticsearch instance running on localhost. To connect to a different Elasticsearch instance, modify the Elasticsearch URL in the kibana.yml configuration file and restart Kibana. For information about using Kibana with your production nodes, see Using Kibana in a Production Environment.
To configure the Elasticsearch indices you want to access with Kibana:
1. Point your browser at port 5601 to access the Kibana UI. For example, localhost:5601 or http://YOURDOMAIN.com:5601.
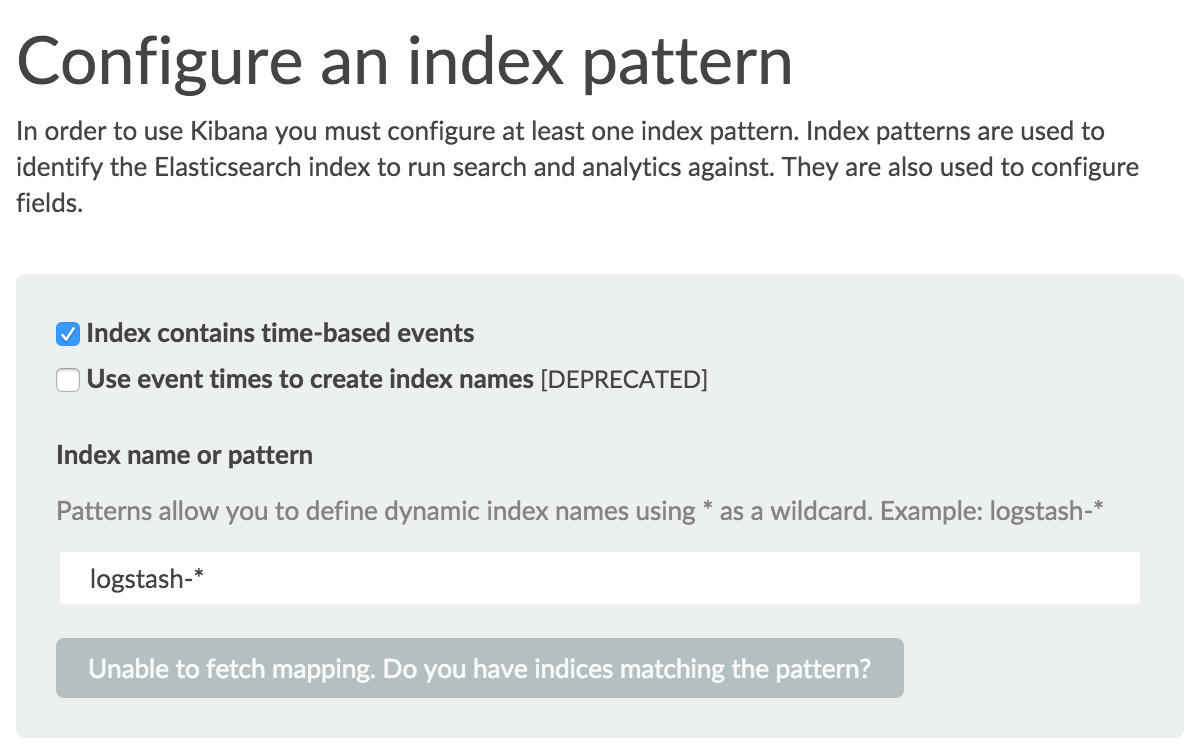
2. Specify an index pattern that matches the name of one or more of your Elasticsearch indices. By default, Kibana guesses that you’re working with data being fed into Elasticsearch by Logstash. If that’s the case, you can use the default logstash-* as your index pattern. The asterisk (*) matches zero or more characters in an index’s name. If your Elasticsearch indices follow some other naming convention, enter an appropriate pattern. The “pattern” can also simply be the name of a single index.
3. Select the index field that contains the timestamp that you want to use to perform time-based comparisons. Kibana reads the index mapping to list all of the fields that contain a timestamp. If your index doesn’t have time-based data, disable the Index contains time-based events option.
4. Click Create to add the index pattern. This first pattern is automatically configured as the default. When you have more than one index pattern, you can designate which one to use as the default from Settings > Indices.
Voila! Kibana is now connected to your Elasticsearch data. Kibana displays a read-only list of fields configured for the matching index.
Start Exploring your Data!
You’re ready to dive in to your data:
• Search and browse your data interactively from the Discover page.
• Chart and map your data from the Visualize page.
• Create and view custom dashboards from the Dashboard page.

相关文章推荐
- 高级专家系统课程及资源
- 15电气李丹【给15个数字排序】
- 对理想团队模式构建的设想以及对软件流程的理解
- NET 分布式架构开发项目实战
- Delphi实现窗口一直在桌面工作区内显示(重写WM_WINDOWPOSCHANGING消息)
- L8-DOM操作应用
- Android入门(一)
- PXE批量安装操作系统
- java测试方法和代码的运行时间
- 教育技术余晓红
- 命令行删除tomcat
- C++作业2
- hdu1234开门人和关门人
- Java学习笔记(三)之― Java中的变量、数据类型、运算符、类型转换
- CBC和CTR解密模式——C++实现
- 感慨
- 比大小
- Android 通过httpclient请求web服务器,并解决用户登录session保持
- sphinx站内搜索
- iOS设计模式之一:MVC模式和单例模式