《CLR Via C#》Visual Studio编译之后的.pdb文件
2016-03-20 20:34
399 查看
在用Visual Studio新建项目之后,进行编译,总会发现.pdb文件:
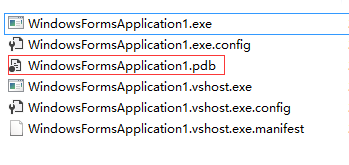
在CLR Via C#中讲到,.pdb文件是用来调试用的。pdb是Program Database的简写,它能够进行source code和IL之间的映射。
The compiler produces a Program Database (PDB) file only if you specify the /debug(+/full/pdbonly) switch. The PDB file helps the debugger find local variables and map the IL instructions to source code.【这是IL和Source Code之间的映射】 The /debug:full switch tells the JIT compiler that you intend to debug the assembly, and the JIT compiler will track what native code came from each IL instruction【这是IL和native code之间的映射】. This allows you to use the just-in-time debugger feature of Visual Studio to connect a debugger to an already-running process and debug the code easily【/debug:full提供的功能,是不是指“附加到进程”呢?】. Without the /debug:full switch, the JIT compiler does not, by default, track the IL to native code information, which makes the JIT compiler run a little faster and also uses a little less memory. If you start a process with the Visual Studio debugger, it forces the JIT compiler to track the IL to native code information (regardless of the /debug switch) unless you turn off the Suppress JIT Optimization On Module Load (Managed Only) option in Visual Studio.
When you create a new C# project in Visual Studio, the Debug configuration of the project has /optimize-- and /debug:full switches, and the Release configuration has /optimize+ and /debug:pdbonly switches specified.【在Visual Studio中Debug和Release两个选项,对这两个参数的影响】

相关文章推荐
- c#调用COM组件
- C#实现把指定数据写入串口
- C#动态创建button的方法
- C#中抽象方法与虚拟方法的区别
- c#中虚函数的相关使用方法
- C#实现给图片加水印的方法
- C#使用加边法计算行列式的值
- C#实现多线程的同步方法实例分析
- C#中尾递归的使用、优化及编译器优化
- C#中的delegate委托类型基本学习教程
- C#实现子窗体与父窗体通信方法实例总结
- C#通用邮件发送类分享
- 举例讲解C#中自动实现的属性
- C#中this的用法集锦
- C#数据结构之顺序表(SeqList)实例详解
- C#.NET获取拨号连接的宽带连接方法
- C#异步绑定数据实现方法
- C#实现AddRange为数组添加多个元素的方法
- C#中Equality和Identity浅析
- C#比较二个数组并找出相同或不同元素的方法