The python debugger调试(PDB)的简介
2016-03-15 19:10
507 查看
学习Python调试,最好的资料当然是官方文档和(pdb)help了,这里有篇博文,还有下面的 PDB
cheat-sheet
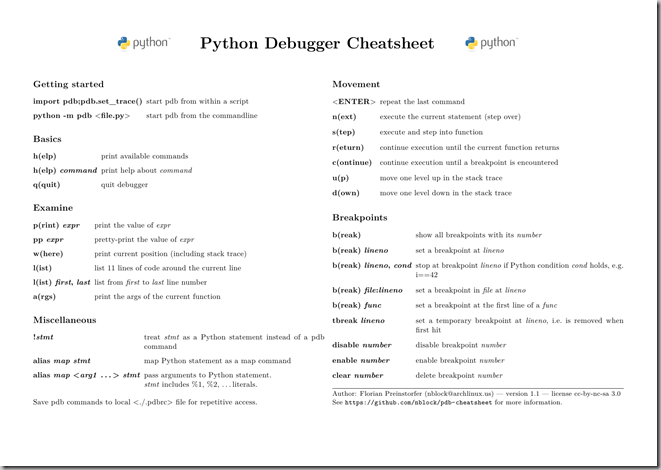
1 在python中使用pdb模块可以进行调试
import pdb
pdb.set_trace()
2 也可以使用python -m pdb mysqcript.py这样的方式;(Pdb) 会自动停在第一行,等待调试;这时你可以看看帮助 (Pdb) h(elp)
说明下这几个关键 命令
>断点设置
(Pdb)b 10 #断点设置在本py的第10行
或(Pdb)b ots.py:20 #断点设置到 ots.py第20行
删除断点(Pdb)b #查看断点编号
(Pdb)cl 2 #删除第2个断点
>运行
(Pdb)n #单步运行
(Pdb)s #细点运行 也就是会下到,方法
(Pdb)c #跳到下个断点
>查看
(Pdb)p param #查看当前 变量值
(Pdb)l #查看运行到某处代码
(Pdb)a #查看全部栈内变量
(Pdb)w 列出目前call stack 中的所在层。
(Pdb)d 在call stack中往下移一层
(Pdb)u 在call stack中往上移一层。如果在上移一层之后按下 n ,则会在上移之后的一层执行下一个叙述,之前的 function call 就自动返回。
(Pdb)cl 清除指定的断点。如果没有带参数,则清除所有断点。
(Pdb)disable 取消所有断点的功能,但仍然保留这些断点。
(Pdb)enable 恢复断点的功能。
(Pdb)ignore 设定断点的忽略次数。如果没指定 count,其初始 为 0。当 count 为 0 时,断点会正常动作。若有指定 count,则每次执行到该中断, count 就少 1,直到 count 数为 0。
(Pdb)condition bpnumber [condition]
(Pdb)j(ump) lineNo. 跳到某行执行。只有在 call stack 的最底部才能作用。
(Pdb)l 列出目前所在档案中的位置。连续地 l 命令会一直列到档案结尾,可以使用指定行数或范围来打印。
(Pdb)pp 和 p 命令类似,但是使用 pprint module(没用过 pprint,详情请参考 Python Library Reference)。
(Pdb)alias 以一个"别名"代替"一群除错命令",有点类似 c/c 的 macro(详情请参考 Python Library Reference)。
(Pdb)unalias 取消某个 alias。
(Pdb)[!]statement 在目前的环境(context)中执行叙述。
from: http://www.cnblogs.com/wei-li/archive/2012/05/02/2479082.html
Source code: Lib/pdb.py
The module
an interactive source code debugger for Python programs. It supports setting (conditional) breakpoints and single stepping at the source line level, inspection of stack frames, source code listing, and evaluation of arbitrary Python code in the context of
any stack frame. It also supports post-mortem debugging and can be called under program control.
The debugger is extensible — it is actually defined as the class
This is currently undocumented but easily understood by reading the source. The extension interface uses the modules
The debugger’s prompt is
control of the debugger is:
>>>
For example:
When invoked as a script, pdb will automatically enter post-mortem debugging if the program being debugged exits abnormally. After post-mortem debugging (or after normal exit of the program), pdb will restart
the program. Automatic restarting preserves pdb’s state (such as breakpoints) and in most cases is more useful than quitting the debugger upon program’s exit.
New in version 2.4: Restarting post-mortem behavior added.
The typical usage to break into the debugger from a running program is to insert
at the location you want to break into the debugger. You can then step through the code following this statement, and continue running without the debugger using the
The typical usage to inspect a crashed program is:
>>>
The module defines the following functions; each enters the debugger in a slightly different way:
Execute the statement (given as a string) under debugger control. The debugger prompt appears before any code is executed; you can set breakpoints and type
or you can step through the statement using
these commands are explained below). The optional globals and locals arguments specify the environment in which the code is executed; by default the dictionary of the module
used. (See the explanation of the
or the
function.)
Evaluate the expression (given as a string) under debugger control. When
it returns the value of the expression. Otherwise this function is similar to
Call the function (a function or method object, not a string) with the given arguments. When
it returns whatever the function call returned. The debugger prompt appears as soon as the function is entered.
Enter the debugger at the calling stack frame. This is useful to hard-code a breakpoint at a given point in a program, even if the code is not otherwise being debugged (e.g. when an assertion fails).
Enter post-mortem debugging of the given traceback object. If no traceback is given, it uses the one of the exception that is currently being handled (an exception must be being handled if the
default is to be used).
Enter post-mortem debugging of the traceback found in
The
aliases for instantiating the
and calling the method of the same name. If you want to access further features, you have to do this yourself:
class
the debugger class.
The completekey, stdin and stdout arguments are passed to the underlying
see the description there.
The skip argument, if given, must be an iterable of glob-style module name patterns. The debugger will not step into frames that originate in a module that matches one of these patterns. [1]
Example call to enable tracing with skip:
New in version 2.7: The skip argument.
See the documentation for the functions explained above.
The debugger recognizes the following commands. Most commands can be abbreviated to one or two letters; e.g.
that either
be used to enter the help command (but not
nor
Arguments to commands must be separated by whitespace (spaces or tabs). Optional arguments are enclosed in square brackets (
in the command syntax; the square brackets must not be typed. Alternatives in the command syntax are separated by a vertical bar (
Entering a blank line repeats the last command entered. Exception: if the last command was a
the next 11 lines are listed.
Commands that the debugger doesn’t recognize are assumed to be Python statements and are executed in the context of the program being debugged. Python statements can also be prefixed with an exclamation point
(
a function. When an exception occurs in such a statement, the exception name is printed but the debugger’s state is not changed.
Multiple commands may be entered on a single line, separated by
(A single
No intelligence is applied to separating the commands; the input is split at the first
middle of a quoted string.
The debugger supports aliases. Aliases can have parameters which allows one a certain level of adaptability to the context under examination.
If a file
or in the current directory, it is read in and executed as if it had been typed at the debugger prompt. This is particularly useful for aliases. If both files exist, the one in the home directory is read first and aliases defined there can be overridden by
the local file.
h(elp) [command]
Without argument, print the list of available commands. With a command as argument, print help about that command.
the full documentation file; if the environment variable
defined, the file is piped through that command instead. Since thecommand argument must be an identifier,
be entered to get help on the
Print a stack trace, with the most recent frame at the bottom. An arrow indicates the current frame, which determines the context of most commands.d(own)
Move the current frame one level down in the stack trace (to a newer frame).u(p)
Move the current frame one level up in the stack trace (to an older frame).b(reak) [[filename:]lineno | function[, condition]]
With a lineno argument, set a break there in the current file. With a function argument, set a break at the first executable statement within that function. The line number
may be prefixed with a filename and a colon, to specify a breakpoint in another file (probably one that hasn’t been loaded yet). The file is searched on
Note that each breakpoint is assigned a number to which all the other breakpoint commands refer.
If a second argument is present, it is an expression which must evaluate to true before the breakpoint is honored.
Without argument, list all breaks, including for each breakpoint, the number of times that breakpoint has been hit, the current ignore count, and the associated condition if any.
tbreak [[filename:]lineno | function[, condition]]
Temporary breakpoint, which is removed automatically when it is first hit. The arguments are the same as break.cl(ear) [filename:lineno | bpnumber [bpnumber ...]]
With a filename:lineno argument, clear all the breakpoints at this line. With a space separated list of breakpoint numbers, clear those breakpoints. Without argument, clear all breaks (but first ask confirmation).disable [bpnumber [bpnumber ...]]
Disables the breakpoints given as a space separated list of breakpoint numbers. Disabling a breakpoint means it cannot cause the program to stop execution, but unlike clearing a breakpoint, it remains in the list of breakpoints and can be (re-)enabled.enable [bpnumber [bpnumber ...]]
Enables the breakpoints specified.ignore bpnumber [count]
Sets the ignore count for the given breakpoint number. If count is omitted, the ignore count is set to 0. A breakpoint becomes active when the ignore count is zero. When non-zero, the count is decremented each time the breakpoint is reached and the breakpoint
is not disabled and any associated condition evaluates to true.condition bpnumber [condition]
Condition is an expression which must evaluate to true before the breakpoint is honored. If condition is absent, any existing condition is removed; i.e., the breakpoint is made unconditional.commands [bpnumber]
Specify a list of commands for breakpoint number bpnumber. The commands themselves appear on the following lines. Type a line containing just ‘end’ to terminate the commands. An
example:
To remove all commands from a breakpoint, type commands and follow it immediately with end; that is, give no commands.
With no bpnumber argument, commands refers to the last breakpoint set.
You can use breakpoint commands to start your program up again. Simply use the continue command, or step, or any other command that resumes execution.
Specifying any command resuming execution (currently continue, step, next, return, jump, quit and their abbreviations) terminates the command list (as if that command was immediately followed by end). This is because
any time you resume execution (even with a simple next or step), you may encounter another breakpoint–which could have its own command list, leading to ambiguities about which list to execute.
If you use the ‘silent’ command in the command list, the usual message about stopping at a breakpoint is not printed. This may be desirable for breakpoints that are to print a specific message and then continue.
If none of the other commands print anything, you see no sign that the breakpoint was reached.
New in version 2.5.
s(tep)
Execute the current line, stop at the first possible occasion (either in a function that is called or on the next line in the current function).n(ext)
Continue execution until the next line in the current function is reached or it returns. (The difference between
that
called functions at (nearly) full speed, only stopping at the next line in the current function.)unt(il)
Continue execution until the line with the line number greater than the current one is reached or when returning from current frame.
New in version 2.6.
r(eturn)
Continue execution until the current function returns.c(ont(inue))
Continue execution, only stop when a breakpoint is encountered.j(ump) lineno
Set the next line that will be executed. Only available in the bottom-most frame. This lets you jump back and execute code again, or jump forward to skip code that you don’t want to run.
It should be noted that not all jumps are allowed — for instance it is not possible to jump into the middle of a
or out of a
l(ist) [first[, last]]
List source code for the current file. Without arguments, list 11 lines around the current line or continue the previous listing. With one argument, list 11 lines around at that line. With two arguments, list the given range; if the second argument is less
than the first, it is interpreted as a count.a(rgs)
Print the argument list of the current function.p expression
Evaluate the expression in the current context and print its value.
Note
pp expression
Like the
Creates an alias called name that executes command. The command must not be enclosed in quotes. Replaceable parameters can be indicated by
and so on, while
shown. If no arguments are given, all aliases are listed.
Aliases may be nested and can contain anything that can be legally typed at the pdb prompt. Note that internal pdb commands can be overridden by aliases. Such a command is then hidden until the alias is
removed. Aliasing is recursively applied to the first word of the command line; all other words in the line are left alone.
As an example, here are two useful aliases (especially when placed in the
unalias name
Deletes the specified alias.[!]statement
Execute the (one-line) statement in the context of the current stack frame. The exclamation point can be omitted unless the first word of the statement resembles a debugger command.
To set a global variable, you can prefix the assignment command with a
run [args ...]
Restart the debugged Python program. If an argument is supplied, it is split with “shlex” and the result is used as the new sys.argv. History, breakpoints, actions and debugger options are
preserved. “restart” is an alias for “run”.
New in version 2.6.
q(uit)
Quit from the debugger. The program being executed is aborted.
Footnotes
from: https://docs.python.org/2/library/pdb.html#module-pdb
cheat-sheet
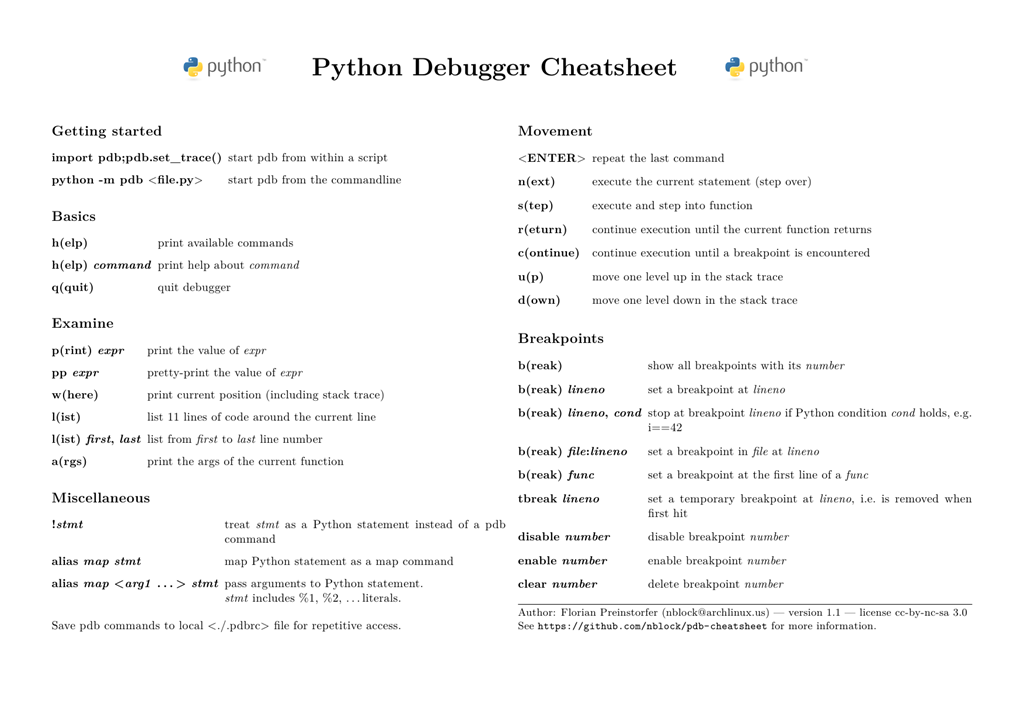
1 在python中使用pdb模块可以进行调试
import pdb
pdb.set_trace()
2 也可以使用python -m pdb mysqcript.py这样的方式;(Pdb) 会自动停在第一行,等待调试;这时你可以看看帮助 (Pdb) h(elp)
说明下这几个关键 命令
>断点设置
(Pdb)b 10 #断点设置在本py的第10行
或(Pdb)b ots.py:20 #断点设置到 ots.py第20行
删除断点(Pdb)b #查看断点编号
(Pdb)cl 2 #删除第2个断点
>运行
(Pdb)n #单步运行
(Pdb)s #细点运行 也就是会下到,方法
(Pdb)c #跳到下个断点
>查看
(Pdb)p param #查看当前 变量值
(Pdb)l #查看运行到某处代码
(Pdb)a #查看全部栈内变量
(Pdb)w 列出目前call stack 中的所在层。
(Pdb)d 在call stack中往下移一层
(Pdb)u 在call stack中往上移一层。如果在上移一层之后按下 n ,则会在上移之后的一层执行下一个叙述,之前的 function call 就自动返回。
(Pdb)cl 清除指定的断点。如果没有带参数,则清除所有断点。
(Pdb)disable 取消所有断点的功能,但仍然保留这些断点。
(Pdb)enable 恢复断点的功能。
(Pdb)ignore 设定断点的忽略次数。如果没指定 count,其初始 为 0。当 count 为 0 时,断点会正常动作。若有指定 count,则每次执行到该中断, count 就少 1,直到 count 数为 0。
(Pdb)condition bpnumber [condition]
(Pdb)j(ump) lineNo. 跳到某行执行。只有在 call stack 的最底部才能作用。
(Pdb)l 列出目前所在档案中的位置。连续地 l 命令会一直列到档案结尾,可以使用指定行数或范围来打印。
(Pdb)pp 和 p 命令类似,但是使用 pprint module(没用过 pprint,详情请参考 Python Library Reference)。
(Pdb)alias 以一个"别名"代替"一群除错命令",有点类似 c/c 的 macro(详情请参考 Python Library Reference)。
(Pdb)unalias 取消某个 alias。
(Pdb)[!]statement 在目前的环境(context)中执行叙述。
from: http://www.cnblogs.com/wei-li/archive/2012/05/02/2479082.html
26.2. pdb
—
The Python Debugger
Source code: Lib/pdb.pyThe module
pdbdefines
an interactive source code debugger for Python programs. It supports setting (conditional) breakpoints and single stepping at the source line level, inspection of stack frames, source code listing, and evaluation of arbitrary Python code in the context of
any stack frame. It also supports post-mortem debugging and can be called under program control.
The debugger is extensible — it is actually defined as the class
Pdb.
This is currently undocumented but easily understood by reading the source. The extension interface uses the modules
bdband
cmd.
The debugger’s prompt is
(Pdb). Typical usage to run a program under
control of the debugger is:
>>>
>>> import pdb
>>> import mymodule
>>> pdb.run('mymodule.test()')
> <string>(0)?()
(Pdb) continue
> <string>(1)?()
(Pdb) continue
NameError: 'spam'
> <string>(1)?()
(Pdb)pdb.pycan also be invoked as a script to debug other scripts.
For example:
python -m pdb myscript.py
When invoked as a script, pdb will automatically enter post-mortem debugging if the program being debugged exits abnormally. After post-mortem debugging (or after normal exit of the program), pdb will restart
the program. Automatic restarting preserves pdb’s state (such as breakpoints) and in most cases is more useful than quitting the debugger upon program’s exit.
New in version 2.4: Restarting post-mortem behavior added.
The typical usage to break into the debugger from a running program is to insert
import pdb; pdb.set_trace()
at the location you want to break into the debugger. You can then step through the code following this statement, and continue running without the debugger using the
ccommand.
The typical usage to inspect a crashed program is:
>>>
>>> import pdb
>>> import mymodule
>>> mymodule.test()
Traceback (most recent call last):
File "<stdin>", line 1, in ?
File "./mymodule.py", line 4, in test
test2()
File "./mymodule.py", line 3, in test2
print spam
NameError: spam
>>> pdb.pm()
> ./mymodule.py(3)test2()
-> print spam
(Pdb)
The module defines the following functions; each enters the debugger in a slightly different way:
pdb.
run(statement[, globals[, locals]])
Execute the statement (given as a string) under debugger control. The debugger prompt appears before any code is executed; you can set breakpoints and type
continue,
or you can step through the statement using
stepor
next(all
these commands are explained below). The optional globals and locals arguments specify the environment in which the code is executed; by default the dictionary of the module
__main__is
used. (See the explanation of the
execstatement
or the
eval()built-in
function.)
pdb.
runeval(expression[, globals[, locals]])
Evaluate the expression (given as a string) under debugger control. When
runeval()returns,
it returns the value of the expression. Otherwise this function is similar to
run().
pdb.
runcall(function[, argument, ...])
Call the function (a function or method object, not a string) with the given arguments. When
runcall()returns,
it returns whatever the function call returned. The debugger prompt appears as soon as the function is entered.
pdb.
set_trace()
Enter the debugger at the calling stack frame. This is useful to hard-code a breakpoint at a given point in a program, even if the code is not otherwise being debugged (e.g. when an assertion fails).
pdb.
post_mortem([traceback])
Enter post-mortem debugging of the given traceback object. If no traceback is given, it uses the one of the exception that is currently being handled (an exception must be being handled if the
default is to be used).
pdb.
pm()
Enter post-mortem debugging of the traceback found in
sys.last_traceback.
The
run*functions and
set_trace()are
aliases for instantiating the
Pdbclass
and calling the method of the same name. If you want to access further features, you have to do this yourself:
class
pdb.
Pdb(completekey='tab', stdin=None, stdout=None, skip=None)
Pdbis
the debugger class.
The completekey, stdin and stdout arguments are passed to the underlying
cmd.Cmdclass;
see the description there.
The skip argument, if given, must be an iterable of glob-style module name patterns. The debugger will not step into frames that originate in a module that matches one of these patterns. [1]
Example call to enable tracing with skip:
import pdb; pdb.Pdb(skip=['django.*']).set_trace()
New in version 2.7: The skip argument.
run(statement[, globals[, locals]])
runeval(expression[, globals[, locals]])
runcall(function[, argument, ...])
set_trace()
See the documentation for the functions explained above.
26.3. Debugger Commands
The debugger recognizes the following commands. Most commands can be abbreviated to one or two letters; e.g. h(elp)means
that either
hor
helpcan
be used to enter the help command (but not
heor
hel,
nor
Hor
Helpor
HELP).
Arguments to commands must be separated by whitespace (spaces or tabs). Optional arguments are enclosed in square brackets (
[])
in the command syntax; the square brackets must not be typed. Alternatives in the command syntax are separated by a vertical bar (
|).
Entering a blank line repeats the last command entered. Exception: if the last command was a
listcommand,
the next 11 lines are listed.
Commands that the debugger doesn’t recognize are assumed to be Python statements and are executed in the context of the program being debugged. Python statements can also be prefixed with an exclamation point
(
!). This is a powerful way to inspect the program being debugged; it is even possible to change a variable or call
a function. When an exception occurs in such a statement, the exception name is printed but the debugger’s state is not changed.
Multiple commands may be entered on a single line, separated by
;;.
(A single
;is not used as it is the separator for multiple commands in a line that is passed to the Python parser.)
No intelligence is applied to separating the commands; the input is split at the first
;;pair, even if it is in the
middle of a quoted string.
The debugger supports aliases. Aliases can have parameters which allows one a certain level of adaptability to the context under examination.
If a file
.pdbrcexists in the user’s home directory
or in the current directory, it is read in and executed as if it had been typed at the debugger prompt. This is particularly useful for aliases. If both files exist, the one in the home directory is read first and aliases defined there can be overridden by
the local file.
h(elp) [command]
Without argument, print the list of available commands. With a command as argument, print help about that command.
help pdbdisplays
the full documentation file; if the environment variable
PAGERis
defined, the file is piped through that command instead. Since thecommand argument must be an identifier,
help execmust
be entered to get help on the
!command.w(here)
Print a stack trace, with the most recent frame at the bottom. An arrow indicates the current frame, which determines the context of most commands.d(own)
Move the current frame one level down in the stack trace (to a newer frame).u(p)
Move the current frame one level up in the stack trace (to an older frame).b(reak) [[filename:]lineno | function[, condition]]
With a lineno argument, set a break there in the current file. With a function argument, set a break at the first executable statement within that function. The line number
may be prefixed with a filename and a colon, to specify a breakpoint in another file (probably one that hasn’t been loaded yet). The file is searched on
sys.path.
Note that each breakpoint is assigned a number to which all the other breakpoint commands refer.
If a second argument is present, it is an expression which must evaluate to true before the breakpoint is honored.
Without argument, list all breaks, including for each breakpoint, the number of times that breakpoint has been hit, the current ignore count, and the associated condition if any.
tbreak [[filename:]lineno | function[, condition]]
Temporary breakpoint, which is removed automatically when it is first hit. The arguments are the same as break.cl(ear) [filename:lineno | bpnumber [bpnumber ...]]
With a filename:lineno argument, clear all the breakpoints at this line. With a space separated list of breakpoint numbers, clear those breakpoints. Without argument, clear all breaks (but first ask confirmation).disable [bpnumber [bpnumber ...]]
Disables the breakpoints given as a space separated list of breakpoint numbers. Disabling a breakpoint means it cannot cause the program to stop execution, but unlike clearing a breakpoint, it remains in the list of breakpoints and can be (re-)enabled.enable [bpnumber [bpnumber ...]]
Enables the breakpoints specified.ignore bpnumber [count]
Sets the ignore count for the given breakpoint number. If count is omitted, the ignore count is set to 0. A breakpoint becomes active when the ignore count is zero. When non-zero, the count is decremented each time the breakpoint is reached and the breakpoint
is not disabled and any associated condition evaluates to true.condition bpnumber [condition]
Condition is an expression which must evaluate to true before the breakpoint is honored. If condition is absent, any existing condition is removed; i.e., the breakpoint is made unconditional.commands [bpnumber]
Specify a list of commands for breakpoint number bpnumber. The commands themselves appear on the following lines. Type a line containing just ‘end’ to terminate the commands. An
example:
(Pdb) commands 1
(com) print some_variable
(com) end
(Pdb)
To remove all commands from a breakpoint, type commands and follow it immediately with end; that is, give no commands.
With no bpnumber argument, commands refers to the last breakpoint set.
You can use breakpoint commands to start your program up again. Simply use the continue command, or step, or any other command that resumes execution.
Specifying any command resuming execution (currently continue, step, next, return, jump, quit and their abbreviations) terminates the command list (as if that command was immediately followed by end). This is because
any time you resume execution (even with a simple next or step), you may encounter another breakpoint–which could have its own command list, leading to ambiguities about which list to execute.
If you use the ‘silent’ command in the command list, the usual message about stopping at a breakpoint is not printed. This may be desirable for breakpoints that are to print a specific message and then continue.
If none of the other commands print anything, you see no sign that the breakpoint was reached.
New in version 2.5.
s(tep)
Execute the current line, stop at the first possible occasion (either in a function that is called or on the next line in the current function).n(ext)
Continue execution until the next line in the current function is reached or it returns. (The difference between
nextand
stepis
that
stepstops inside a called function, while
nextexecutes
called functions at (nearly) full speed, only stopping at the next line in the current function.)unt(il)
Continue execution until the line with the line number greater than the current one is reached or when returning from current frame.
New in version 2.6.
r(eturn)
Continue execution until the current function returns.c(ont(inue))
Continue execution, only stop when a breakpoint is encountered.j(ump) lineno
Set the next line that will be executed. Only available in the bottom-most frame. This lets you jump back and execute code again, or jump forward to skip code that you don’t want to run.
It should be noted that not all jumps are allowed — for instance it is not possible to jump into the middle of a
forloop
or out of a
finallyclause.
l(ist) [first[, last]]
List source code for the current file. Without arguments, list 11 lines around the current line or continue the previous listing. With one argument, list 11 lines around at that line. With two arguments, list the given range; if the second argument is less
than the first, it is interpreted as a count.a(rgs)
Print the argument list of the current function.p expression
Evaluate the expression in the current context and print its value.
Note
pp expression
Like the
pcommand, except the value of the expression is pretty-printed using the
pprintmodule.alias [name [command]]
Creates an alias called name that executes command. The command must not be enclosed in quotes. Replaceable parameters can be indicated by
%1,
%2,
and so on, while
%*is replaced by all the parameters. If no command is given, the current alias for name is
shown. If no arguments are given, all aliases are listed.
Aliases may be nested and can contain anything that can be legally typed at the pdb prompt. Note that internal pdb commands can be overridden by aliases. Such a command is then hidden until the alias is
removed. Aliasing is recursively applied to the first word of the command line; all other words in the line are left alone.
As an example, here are two useful aliases (especially when placed in the
.pdbrcfile):
#Print instance variables (usage "pi classInst")
alias pi for k in %1.__dict__.keys(): print "%1.",k,"=",%1.__dict__[k]
#Print instance variables in self
alias ps pi self
unalias name
Deletes the specified alias.[!]statement
Execute the (one-line) statement in the context of the current stack frame. The exclamation point can be omitted unless the first word of the statement resembles a debugger command.
To set a global variable, you can prefix the assignment command with a
globalcommand on the same line, e.g.:
(Pdb) global list_options; list_options = ['-l']
(Pdb)
run [args ...]
Restart the debugged Python program. If an argument is supplied, it is split with “shlex” and the result is used as the new sys.argv. History, breakpoints, actions and debugger options are
preserved. “restart” is an alias for “run”.
New in version 2.6.
q(uit)
Quit from the debugger. The program being executed is aborted.
Footnotes
| [1] | Whether a frame is considered to originate in a certain module is determined by the __name__in the frame globals. |

相关文章推荐
- Python动态类型的学习---引用的理解
- Python3写爬虫(四)多线程实现数据爬取
- 垃圾邮件过滤器 python简单实现
- 下载并遍历 names.txt 文件,输出长度最长的回文人名。
- Extjs4.0 最新最全视频教程
- Linux 自检和 SystemTap
- install and upgrade scrapy
- Scrapy的架构介绍
- Centos6 编译安装Python
- OpenERP 的XML-RPC的实例+many2many,one2many,many2one...
- CSS3属性教程与案例分享
- 使用Python生成Excel格式的图片
- 让Python文件也可以当bat文件运行
- [Python]推算数独
- Python中zip()函数用法举例
- Python中map()函数浅析
- Python将excel导入到mysql中
- jquery教程靠边站,一分钱不花让你免费学会jquery