[置顶] 拉普拉斯特征图降维及其python实现
2016-03-10 21:35
736 查看
步骤一:构建一个图G=(V,E),其中V={vi,i=1,2,3…n}是顶点的集合,E={eij}是连接顶点的vi和vj边,图的每一个节点vi与样本集X中的一个点xi相关。如果xi,xj相距较近,我们就连接vi,vj。也就是说在各自节点插入一个边eij,如果Xj在xi的k领域中,k是定义参数。
步骤二:每个边都与一个权值Wij相对应,没有连接点之间的权值为0,连接点之间的权值:

步骤三:令

,实现广义本征分解:

使

是最小的m+1个本征值。忽略与

=0相关的本征向量,选取另外m个本征向量即为降维后的向量。
1、python实现拉普拉斯降维
def laplaEigen(dataMat,k,t):
m,n=shape(dataMat)
W=mat(zeros([m,m]))
D=mat(zeros([m,m]))
for i in range(m):
k_index=knn(dataMat[i,:],dataMat,k)
for j in range(k):
sqDiffVector = dataMat[i,:]-dataMat[k_index[j],:]
sqDiffVector=array(sqDiffVector)**2
sqDistances = sqDiffVector.sum()
W[i,k_index[j]]=math.exp(-sqDistances/t)
D[i,i]+=W[i,k_index[j]]
L=D-W
Dinv=np.linalg.inv(D)
X=np.dot(D.I,L)
lamda,f=np.linalg.eig(X)
return lamda,f
def knn(inX, dataSet, k):
dataSetSize = dataSet.shape[0]
diffMat = tile(inX, (dataSetSize,1)) - dataSet
sqDiffMat = array(diffMat)**2
sqDistances = sqDiffMat.sum(axis=1)
distances = sqDistances**0.5
sortedDistIndicies = distances.argsort()
return sortedDistIndicies[0:k]
dataMat, color = make_swiss_roll(n_samples=2000)
lamda,f=laplaEigen(dataMat,11,5.0)
fm,fn =shape(f)
print 'fm,fn:',fm,fn
lamdaIndicies = argsort(lamda)
first=0
second=0
print lamdaIndicies[0], lamdaIndicies[1]
for i in range(fm):
if lamda[lamdaIndicies[i]].real>1e-5:
print lamda[lamdaIndicies[i]]
first=lamdaIndicies[i]
second=lamdaIndicies[i+1]
break
print first, second
redEigVects = f[:,lamdaIndicies]
fig=plt.figure('origin')
ax1 = fig.add_subplot(111, projection='3d')
ax1.scatter(dataMat[:, 0], dataMat[:, 1], dataMat[:, 2], c=color,cmap=plt.cm.Spectral)
fig=plt.figure('lowdata')
ax2 = fig.add_subplot(111)
ax2.scatter(f[:,first], f[:,second], c=color, cmap=plt.cm.Spectral)
plt.show()
2、拉普拉斯降维实验
用如下参数生成实验数据存在swissdata.dat里面:def make_swiss_roll(n_samples=100, noise=0.0, random_state=None): #Generate a swiss roll dataset. t = 1.5 * np.pi * (1 + 2 * random.rand(1, n_samples)) x = t * np.cos(t) y = 83 * random.rand(1, n_samples) z = t * np.sin(t) X = np.concatenate((x, y, z)) X += noise * random.randn(3, n_samples) X = X.T t = np.squeeze(t) return X, t
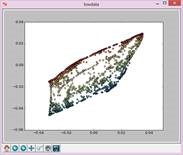
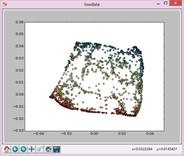
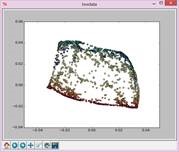
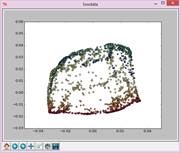
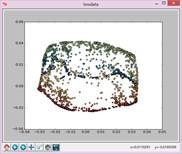
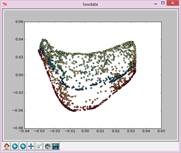
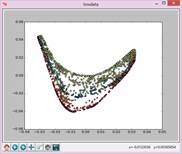
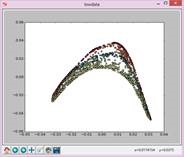
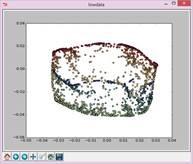
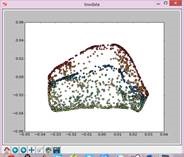
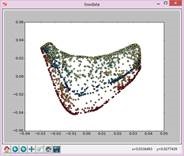
实验结果如下:
N=5,t=15: N=7,t=15: N=9,t=15:
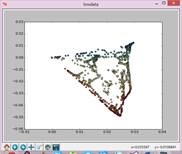
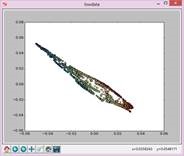
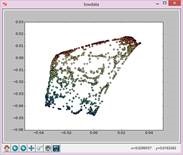
N=11,t=15: N=13,t=15: N=15,t=15:
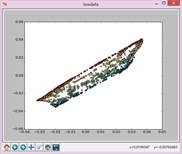
N=17,t=15: N=19,t=15: N=21,t=15:

N=23,t=15: N=25,t=15: N=27,t=15:


N=29,t=15: N=31,t=15: N=33,t=15:
N=25,t=5: N=25,t=8: N=25,t=10:


N=25,t=12: N=25,t=14: N=25,t=50:

N=25,t=Inf:

相关文章推荐
- python爬虫 爬去vamei的python快速教程
- python元编程--设计一个可接受参数的装饰器
- Python 中文注释报错解决方案
- python的入门教程 资源
- Python-线程内的全局变量
- 写了一个hello.py,运行出错,提示 File "<stdin>" , line 1
- [置顶] KNN及其改进算法的python实现
- [置顶] 利用python进行折线图,直方图和饼图的绘制
- Python安装、配置
- eclipse 编译python时控制台的中文输出时乱码
- php curl vs python提交多维数组+文件
- Python 拷贝对象(深拷贝deepcopy与浅拷贝copy)
- Pipe-python的stream
- Python 日志模块的定制
- Python基础——module
- Python变量作用域
- sqlite3(python3.4 demo in doc)
- Python基础——列表、元组、字典
- Python 灰帽子笔记之调试器
- Python 网页爬虫 & 文本处理 & 科学计算 & 机器学习 & 数据挖掘兵器谱