Model Thinking的几个模型杂记
2016-03-08 15:01
337 查看
这周是期中考试,前面近两个月所学有些遗忘,这边记录一下。
没学过的可以去看一下,老师语速略快,一开始可能不适应,幸好有字幕。
模型在时间变量的作用下,产出结果的规律分为四大类:
* Equilibrium
* Cycle
* Random
* Complex
建立了一个基于邻居情况与自己匹配程度达不到x%是否决定搬家的模型,软件自动模拟的结果是:
* x = 40, 最终整体统计在 79.5%
* x = 52, 最终整体统计在 93.8%
* x = 80, 最终软件模拟无解,人们一直在搬家
结论是:
\frac{\sum \left ( N_{i}R_{i} \right )}{2}
主要是判断某一个区域混杂性的指标,0的话就是完全混杂,1是完全对立。
如下图中,蓝色是纯富人区,每个block住10人,绿色为混住,每个block 5穷5富,黄色都是穷人,每个block住10人,分别计算每个block的Ri,就行了。(计算方式见下面)
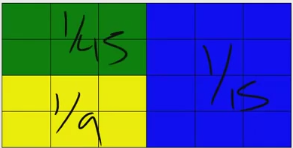
ID’= ½ { 6(1/45) + 6(1/9) + 12(1/15)} =
½{72/45} = ½ {1.60} = 0.8 for normalized metric
Ri = distortion metric i, |b/B – y/Y|
b=# blue in block, B=# blue total (150)
y=#yellow in block, Y=#yellow total (90)
Ni = number of blocks with Ri value
Model: N individuals, Each with a Threshold
(Tj for person j), Rule: join if Tj others join
Builds off of Granovettor’s Model: people may optimize when they have time to think about it, but also may just follow simple rules when they don’t – as in a standing ovation.
Assumptions: (a) Peer Effect, (b) Information – assume other’s competence
Model:
* Threshold to Stand (T),
* Quality of show (Q),
* Signal (S = Q + E) where E = error (noise)
* Initial Rule: If S > T => Stand
* Subsequent Rule: Stand if > X% stand
正太分布下的标准方差 = N*P(1-P)的平方根
\pm1 \delta = 68%, \pm2 \delta = 95%, \pm3 \delta = 99.75%.
所以,一般6个标准方差外的事情,就不要多虑了。
众口难调的例子:
Each Person is RATIONAL but the Collective is IRRATIONAL. The consequence is that in social policy, voting, and group decisions their is opportunity to have strategic preferences to bias the ‘collective preferences’
Spatial Choice Models:在一个范围内的选择,看和谁观点近了,比如党派之争等
决策树,列出每个分支的预期收益,找最大收益即可
信息价值计算:Value of Information Calculation Steps:
(1) Calculate value without the information
(2) Calculate value with the information(change tree, solve as if you knew the answer)
(3) Calculate the difference
第二步略微有点搞,就是信息100%确定的情况下,信息原本的发生概率转换为了你是否走信息所在决策分支的概率,这样就生成了新的决策树,得到不同的值。
Race to the Bottom: Pick a number in [0,100]. The closest to 2/3 of the mean wins. What happens?
我的理解是,别自以为屌,在社会上混,真实的最佳答案往往不是理论的最佳答案。
Hyperbolic Discounting: (双鸟在林不如一鸟在手)Discount the same short period of time difference in the near future more than the same short period of time difference in the far future
Status Quo Bias: (懒人) Donate organs: UK uses ‘check box to donate’ with 10% marking the box. Europe countries using ‘Not contribute organs’ have only 10% marking the box. Implies strong status quo bias.
Base Rate Bias: (定锚)Ask year box made then ask what price. The first number influences the estimate of the second number.
Fix Strategy: Divide evenly or Tit for Tat Moore Machine
Tit for Tat - change state if opponent switches
Grim Trigger – if defect go to mean and stay there
Decision vs Game:
* Decision: Objective depends only on own action
* Game: Objective depends on actions of others
1 - (合体后的delta - 各个分类delta之和)/ 合体后的delta
* R-squared near 1 model explains a lot,就是靠谱的意思
* R-squared near 0 model explains little,就是乱来的意思
* Data quality impacts a good model’s R-squared
R-squared通过y轴平均值的水平线的均方差为底,找匹配的
做个专业的看图手
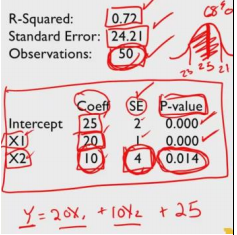
* R-Squared – how much of the data is explained,
* Observations – how many data points,
* Standard Error – How much variation in the data to begin with
* Linear Model – Intercept (sign and magnitude, SE and probability of sign error)
* Linear Model – Coefficients of independent variables (sign and magnitude, SE & probability of sign error)
课程入口
module thinking没学过的可以去看一下,老师语速略快,一开始可能不适应,幸好有字幕。
Segregation / Peer Effects
通过不同的模型,而不是个人的情感来模拟(mimic)真实世界,会更准确。同时,也能将复杂的问题简单化。模型在时间变量的作用下,产出结果的规律分为四大类:
* Equilibrium
* Cycle
* Random
* Complex
Schelling’s Segregation Model
基于纽约住宅区人口结构的分布调查,有明显的人种和收入的区块划分。这是自主选择的结果。建立了一个基于邻居情况与自己匹配程度达不到x%是否决定搬家的模型,软件自动模拟的结果是:
* x = 40, 最终整体统计在 79.5%
* x = 52, 最终整体统计在 93.8%
* x = 80, 最终软件模拟无解,人们一直在搬家
结论是:
Observed macrobehavior does not automatically imply biased micromotives!
Index of Dissimilarity:
∑(NiRi)2\frac{\sum \left ( N_{i}R_{i} \right )}{2}
吐槽:尝试了LaTeX语句未正确显示,这里的markdown不支持数学公式?
主要是判断某一个区域混杂性的指标,0的话就是完全混杂,1是完全对立。
如下图中,蓝色是纯富人区,每个block住10人,绿色为混住,每个block 5穷5富,黄色都是穷人,每个block住10人,分别计算每个block的Ri,就行了。(计算方式见下面)
ID’= ½ { 6(1/45) + 6(1/9) + 12(1/15)} =
½{72/45} = ½ {1.60} = 0.8 for normalized metric
Ri = distortion metric i, |b/B – y/Y|
b=# blue in block, B=# blue total (150)
y=#yellow in block, Y=#yellow total (90)
Ni = number of blocks with Ri value
Peer Effect
简单地说,就是从众心理Model: N individuals, Each with a Threshold
(Tj for person j), Rule: join if Tj others join
The Standing Ovation Model
简言之,俺是有原则的Builds off of Granovettor’s Model: people may optimize when they have time to think about it, but also may just follow simple rules when they don’t – as in a standing ovation.
Assumptions: (a) Peer Effect, (b) Information – assume other’s competence
Model:
* Threshold to Stand (T),
* Quality of show (Q),
* Signal (S = Q + E) where E = error (noise)
* Initial Rule: If S > T => Stand
* Subsequent Rule: Stand if > X% stand
Aggregation
引入一个game of life的游戏,简单的规则和行为,最后生成的结果(环境)却是复杂的。正太分布下的标准方差 = N*P(1-P)的平方根
\pm1 \delta = 68%, \pm2 \delta = 95%, \pm3 \delta = 99.75%.
所以,一般6个标准方差外的事情,就不要多虑了。
众口难调的例子:
Each Person is RATIONAL but the Collective is IRRATIONAL. The consequence is that in social policy, voting, and group decisions their is opportunity to have strategic preferences to bias the ‘collective preferences’
Decision Models
决策过程建模
Multi-Criterion Decision Making:每项设置比重,看谁占得多。Spatial Choice Models:在一个范围内的选择,看和谁观点近了,比如党派之争等
决策树,列出每个分支的预期收益,找最大收益即可
信息价值计算:Value of Information Calculation Steps:
(1) Calculate value without the information
(2) Calculate value with the information(change tree, solve as if you knew the answer)
(3) Calculate the difference
第二步略微有点搞,就是信息100%确定的情况下,信息原本的发生概率转换为了你是否走信息所在决策分支的概率,这样就生成了新的决策树,得到不同的值。
对人进行建模
有一个很有意思的游戏:Race to the Bottom: Pick a number in [0,100]. The closest to 2/3 of the mean wins. What happens?
我的理解是,别自以为屌,在社会上混,真实的最佳答案往往不是理论的最佳答案。
Behavioral Model: Observe people are not rational.
Prospect Theory: (舍不得吃亏理论)People are risk averse over gains and risk loving over lossesHyperbolic Discounting: (双鸟在林不如一鸟在手)Discount the same short period of time difference in the near future more than the same short period of time difference in the far future
Status Quo Bias: (懒人) Donate organs: UK uses ‘check box to donate’ with 10% marking the box. Europe countries using ‘Not contribute organs’ have only 10% marking the box. Implies strong status quo bias.
Base Rate Bias: (定锚)Ask year box made then ask what price. The first number influences the estimate of the second number.
Rational Model: Objective function (mathematical) to maximize. People OPTIMIZE the Objective function
Rule Based Model: e.g., Schelling, simple rule that is close to what people actually do.
Fix DecisionFix Strategy: Divide evenly or Tit for Tat Moore Machine
Tit for Tat - change state if opponent switches
Grim Trigger – if defect go to mean and stay there
Decision vs Game:
* Decision: Objective depends only on own action
* Game: Objective depends on actions of others
Categorical and Linear Models
学过Machine Learning的话,这里没太多花头,就是谨记,数据有限,眼界有限,有时会误入局部最优陷阱 (local maximum trap)Categorical
R-squared: % variation explained(分类靠谱指数)1 - (合体后的delta - 各个分类delta之和)/ 合体后的delta
* R-squared near 1 model explains a lot,就是靠谱的意思
* R-squared near 0 model explains little,就是乱来的意思
* Data quality impacts a good model’s R-squared
Linear
Linear Model: Best linear fit to a data set. Offset from line is a measure of variation.R-squared通过y轴平均值的水平线的均方差为底,找匹配的
做个专业的看图手
* R-Squared – how much of the data is explained,
* Observations – how many data points,
* Standard Error – How much variation in the data to begin with
* Linear Model – Intercept (sign and magnitude, SE and probability of sign error)
* Linear Model – Coefficients of independent variables (sign and magnitude, SE & probability of sign error)

相关文章推荐
- SmartSvn的使用
- shiro中多用户的登陆页面(multiple login pages)配置
- 连接池和 "Timeout expired"异常【转】
- 线程同步机制
- 我的fckeditor实践
- struts2 默认Action
- 读取assets文件
- MySQL 调编码
- Win7右键没有新建Word、excel、powerpoint
- 设备管理员功能介绍
- Android canvas.save()和canvas.restore()的理解
- CollectionFramework
- 20160308001 GridView的Sorting排序
- 监控工具TCPMon的使用方法
- 数据分析
- Android学习笔记之Fast Json的使用
- 产品经理最好用的工具都在这里了
- [转载]彻底弄清struct和typedef struct
- MySQL timestamp 的一个坑
- CPU和SoC的关系和区别