使用ELK(Elasticsearch + Logstash + Kibana) 搭建日志集中分析平台实践--转载
2016-03-03 16:01
1241 查看
原文地址:https://wsgzao.github.io/post/elk/
另外可以参考:https://www.digitalocean.com/community/tutorials/how-to-install-elasticsearch-logstash-and-kibana-elk-stack-on-ubuntu-14-04
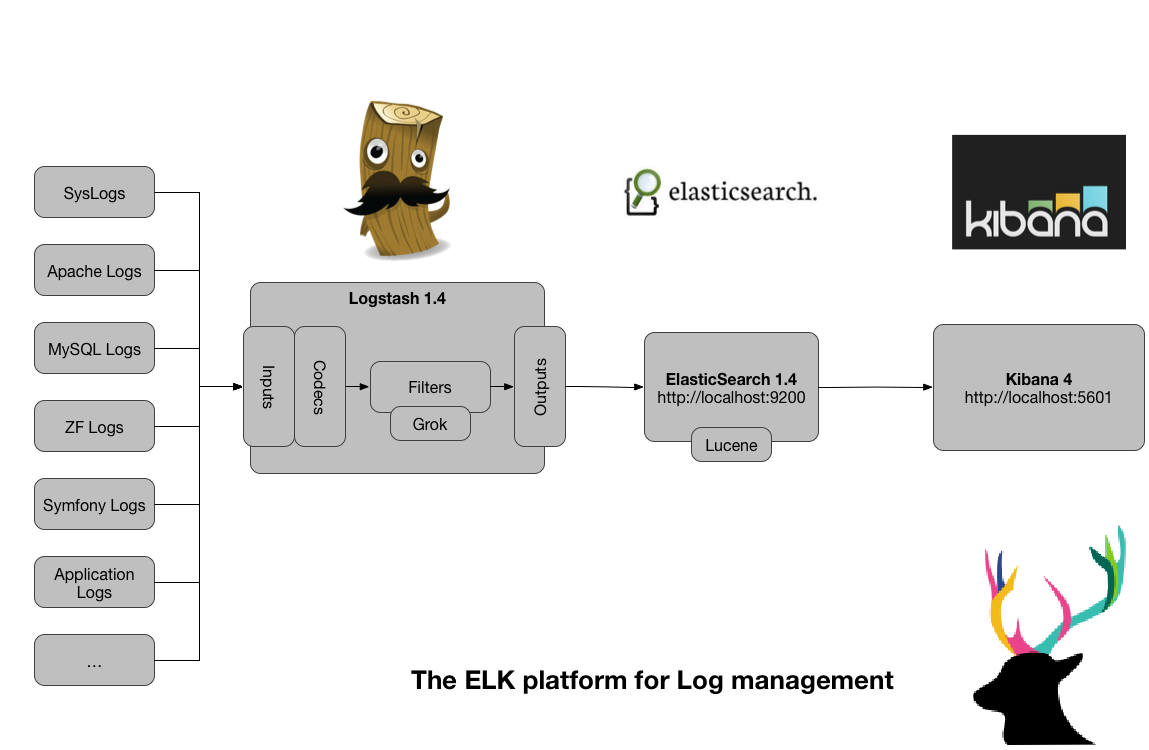
Logstash:负责日志的收集,处理和储存
Elasticsearch:负责日志检索和分析
Kibana:负责日志的可视化
ELK(Elasticsearch + Logstash + Kibana)
阅读原文 - http://wsgzao.github.io/post/elk/
扩展阅读
CentOS 7.x安装ELK(Elasticsearch+Logstash+Kibana) - http://www.chenshake.com/centos-install-7-x-elk-elasticsearchlogstashkibana/
Centos 6.5 安装nginx日志分析系统 elasticsearch + logstash + redis + kibana - http://blog.chinaunix.net/xmlrpc.php?r=blog/article&uid=17291169&id=4898582
logstash-forwarder and grok examples - https://www.ulyaoth.net/threads/logstash-forwarder-and-grok-examples.32413/
三斗室 - http://chenlinux.com/
elastic - https://www.elastic.co/guide
LTMP索引 - http://wsgzao.github.io/index/#LTMP
Elasticsearch - https://www.elastic.co/downloads/elasticsearch
Logstash - https://www.elastic.co/downloads/logstash
Kibana - https://www.elastic.co/downloads/kibana
redis - http://redis.io/download
创建SSL证书的时候需要配置FQDN
另外可以参考:https://www.digitalocean.com/community/tutorials/how-to-install-elasticsearch-logstash-and-kibana-elk-stack-on-ubuntu-14-04
前言
Elasticsearch + Logstash + Kibana(ELK)是一套开源的日志管理方案,分析网站的访问情况时我们一般会借助Google/百度/CNZZ等方式嵌入JS做数据统计,但是当网站访问异常或者被攻击时我们需要在后台分析如Nginx的具体日志,而Nginx日志分割/GoAccess/Awstats都是相对简单的单节点解决方案,针对分布式集群或者数据量级较大时会显得心有余而力不足,而ELK的出现可以使我们从容面对新的挑战。Logstash:负责日志的收集,处理和储存
Elasticsearch:负责日志检索和分析
Kibana:负责日志的可视化
ELK(Elasticsearch + Logstash + Kibana)
更新记录
2015年08月31日 - 初稿阅读原文 - http://wsgzao.github.io/post/elk/
扩展阅读
CentOS 7.x安装ELK(Elasticsearch+Logstash+Kibana) - http://www.chenshake.com/centos-install-7-x-elk-elasticsearchlogstashkibana/
Centos 6.5 安装nginx日志分析系统 elasticsearch + logstash + redis + kibana - http://blog.chinaunix.net/xmlrpc.php?r=blog/article&uid=17291169&id=4898582
logstash-forwarder and grok examples - https://www.ulyaoth.net/threads/logstash-forwarder-and-grok-examples.32413/
三斗室 - http://chenlinux.com/
elastic - https://www.elastic.co/guide
LTMP索引 - http://wsgzao.github.io/index/#LTMP
组件预览
JDK - http://www.oracle.com/technetwork/java/javase/downloads/index.htmlElasticsearch - https://www.elastic.co/downloads/elasticsearch
Logstash - https://www.elastic.co/downloads/logstash
Kibana - https://www.elastic.co/downloads/kibana
redis - http://redis.io/download
设置FQDN
创建SSL证书的时候需要配置FQDN
1 2 3 4 5 6 7 8 9 10 11 12 13 14 15 16 17 18 19 20 21 22 23 | #修改hostname cat /etc/hostname elk #修改hosts cat /etc/hosts 127.0.0.1 localhost localhost.localdomain localhost4 localhost4.localdomain4 ::1 localhost localhost.localdomain localhost6 localhost6.localdomain6 127.0.0.1 10-10-87-19 10.10.87.19 elk.ooxx.com elk #刷新环境 hostname -F /etc/hostname #复查结果 hostname -f elk.ooxx.com hostname elk |
服务端
Java
1 2 3 4 5 6 7 8 9 | cat /etc/redhat-release CentOS release 6.5 (Final) yum install java-1.7.0-openjdk java -version java version "1.7.0_85" OpenJDK Runtime Environment (rhel-2.6.1.3.el6_6-x86_64 u85-b01) OpenJDK 64-Bit Server VM (build 24.85-b03, mixed mode) |
Elasticsearch
1 2 3 4 5 6 7 8 9 10 11 12 13 14 15 16 17 18 19 20 21 22 2324 | #下载安装 wget https://download.elastic.co/elasticsearch/elasticsearch/elasticsearch-1.7.1.noarch.rpm yum localinstall elasticsearch-1.7.1.noarch.rpm #启动相关服务 service elasticsearch start service elasticsearch status #查看Elasticsearch的配置文件 rpm -qc elasticsearch /etc/elasticsearch/elasticsearch.yml /etc/elasticsearch/logging.yml /etc/init.d/elasticsearch /etc/sysconfig/elasticsearch /usr/lib/sysctl.d/elasticsearch.conf /usr/lib/systemd/system/elasticsearch.service /usr/lib/tmpfiles.d/elasticsearch.conf #查看端口使用情况 netstat -nltp Active Internet connections (only servers) Proto Recv-Q Send-Q Local Address Foreign Address State PID/Program name tcp 0 0 0.0.0.0:9200 0.0.0.0:* LISTEN 1765/java tcp 0 0 0.0.0.0:9300 0.0.0.0:* LISTEN 1765/java tcp 0 0 0.0.0.0:22 0.0.0.0:* LISTEN 1509/sshd tcp 0 0 :::22 :::* LISTEN 1509/sshd #测试访问 curl -X GET http://localhost:9200/ |
Kibana
1 2 3 4 5 6 7 8 9 10 11 12 13 14 15 16 17 18 19 20 21 22 2324 | #下载tar包 wget https://download.elastic.co/kibana/kibana/kibana-4.1.1-linux-x64.tar.gz #解压 tar zxf kibana-4.1.1-linux-x64.tar.gz -C /usr/local/ cd /usr/local/ mv kibana-4.1.1-linux-x64 kibana #创建kibana服务 vi /etc/rc.d/init.d/kibana #!/bin/bash ### BEGIN INIT INFO # Provides: kibana # Default-Start: 2 3 4 5 # Default-Stop: 0 1 6 # Short-Description: Runs kibana daemon # Description: Runs the kibana daemon as a non-root user ### END INIT INFO # Process name NAME=kibana DESC="Kibana4" PROG="/etc/init.d/kibana" # Configure location of Kibana bin KIBANA_BIN=/usr/local/kibana/bin # PID Info PID_FOLDER=/var/run/kibana/ PID_FILE=/var/run/kibana/$NAME.pid LOCK_FILE=/var/lock/subsys/$NAME PATH=/bin:/usr/bin:/sbin:/usr/sbin:$KIBANA_BIN DAEMON=$KIBANA_BIN/$NAME # Configure User to run daemon process DAEMON_USER=root # Configure logging location KIBANA_LOG=/var/log/kibana.log # Begin Script RETVAL=0 if [ `id -u` -ne 0 ]; then echo "You need root privileges to run this script" exit 1 fi # Function library . /etc/init.d/functions start() { echo -n "Starting $DESC : " pid=`pidofproc -p $PID_FILE kibana` if [ -n "$pid" ] ; then echo "Already running." exit 0 else # Start Daemon if [ ! -d "$PID_FOLDER" ] ; then mkdir $PID_FOLDER fi daemon --user=$DAEMON_USER --pidfile=$PID_FILE $DAEMON 1>"$KIBANA_LOG" 2>&1 & sleep 2 pidofproc node > $PID_FILE RETVAL=$? [[ $? -eq 0 ]] && success || failure echo [ $RETVAL = 0 ] && touch $LOCK_FILE return $RETVAL fi } reload() { echo "Reload command is not implemented for this service." return $RETVAL } stop() { echo -n "Stopping $DESC : " killproc -p $PID_FILE $DAEMON RETVAL=$? echo [ $RETVAL = 0 ] && rm -f $PID_FILE $LOCK_FILE } case "$1" in start) start ;; stop) stop ;; status) status -p $PID_FILE $DAEMON RETVAL=$? ;; restart) stop start ;; reload) reload ;; *) # Invalid Arguments, print the following message. echo "Usage: $0 {start|stop|status|restart}" >&2 exit 2 ;; esac #修改启动权限 chmod +x /etc/rc.d/init.d/kibana #启动kibana服务 service kibana start service kibana status #查看端口 netstat -nltp Active Internet connections (only servers) Proto Recv-Q Send-Q Local Address Foreign Address State PID/Program name tcp 0 0 0.0.0.0:9200 0.0.0.0:* LISTEN 1765/java tcp 0 0 0.0.0.0:9300 0.0.0.0:* LISTEN 1765/java tcp 0 0 0.0.0.0:22 0.0.0.0:* LISTEN 1509/sshd tcp 0 0 0.0.0.0:5601 0.0.0.0:* LISTEN 1876/node tcp 0 0 :::22 :::* LISTEN 1509/sshd |
Logstash
1 2 3 4 5 6 7 8 9 10 11 12 13 14 15 16 17 18 19 20 21 22 2324 | #下载rpm包 wget https://download.elastic.co/logstash/logstash/packages/centos/logstash-1.5.4-1.noarch.rpm #安装 yum localinstall logstash-1.5.4-1.noarch.rpm #设置ssl,之前设置的FQDN是elk.ooxx.com cd /etc/pki/tls #openssl req -x509 -batch -nodes -newkey rsa:2048 -keyout lumberjack.key -out lumberjack.crt -subj /CN=logstash.example.com openssl req -subj '/CN=elk.ooxx.com/' -x509 -days 3650 -batch -nodes -newkey rsa:2048 -keyout private/logstash-forwarder.key -out certs/logstash-forwarder.crt #创建一个01-logstash-initial.conf文件 cat > /etc/logstash/conf.d/01-logstash-initial.conf << EOF input { lumberjack { port => 5000 type => "logs" ssl_certificate => "/etc/pki/tls/certs/logstash-forwarder.crt" ssl_key => "/etc/pki/tls/private/logstash-forwarder.key" } } filter { if [type] == "syslog" { grok { match => { "message" => "%{SYSLOGTIMESTAMP:syslog_timestamp} %{SYSLOGHOST:syslog_hostname} %{DATA:syslog_program}(?:\[%{POSINT:syslog_pid}\])?: %{GREEDYDATA:syslog_message}" } add_field => [ "received_at", "%{@timestamp}" ] add_field => [ "received_from", "%{host}" ] } syslog_pri { } date { match => [ "syslog_timestamp", "MMM d HH:mm:ss", "MMM dd HH:mm:ss" ] } } } output { elasticsearch { host => localhost } stdout { codec => rubydebug } } EOF #启动logstash服务 service logstash start service logstash status #查看5000端口 netstat -nltp Active Internet connections (only servers) Proto Recv-Q Send-Q Local Address Foreign Address State PID/Program name tcp 0 0 0.0.0.0:9200 0.0.0.0:* LISTEN 1765/java tcp 0 0 0.0.0.0:9300 0.0.0.0:* LISTEN 1765/java tcp 0 0 0.0.0.0:9301 0.0.0.0:* LISTEN 2309/java tcp 0 0 0.0.0.0:22 0.0.0.0:* LISTEN 1509/sshd tcp 0 0 0.0.0.0:5601 0.0.0.0:* LISTEN 1876/node tcp 0 0 0.0.0.0:5000 0.0.0.0:* LISTEN 2309/java tcp 0 0 :::22 :::* LISTEN 1509/sshd #启动服务 service logstash-forwarder start service logstash-forwarder status #访问Kibana,Time-field name 选择 @timestamp http://localhost:5601/ #增加节点和客户端配置一样,注意同步证书 /etc/pki/tls/certs/logstash-forwarder.crt |
客户端
Logstash Forwarder
1 2 3 4 5 6 7 8 9 10 11 12 13 14 15 16 17 18 19 20 21 22 2324 | #登陆到客户端,安装Logstash Forwarder wget https://download.elastic.co/logstash-forwarder/binaries/logstash-forwarder-0.4.0-1.x86_64.rpm yum localinstall logstash-forwarder-0.4.0-1.x86_64.rpm #查看logstash-forwarder的配置文件位置 rpm -qc logstash-forwarder /etc/logstash-forwarder.conf #备份配置文件 cp /etc/logstash-forwarder.conf /etc/logstash-forwarder.conf.save #编辑 /etc/logstash-forwarder.conf,需要根据实际情况进行修改 cat > /etc/logstash-forwarder.conf << EOF { "network": { "servers": [ "elk.ooxx.com:5000" ], "ssl ca": "/etc/pki/tls/certs/logstash-forwarder.crt", "timeout": 15 }, "files": [ { "paths": [ "/var/log/messages", "/var/log/secure" ], "fields": { "type": "syslog" } } ] } EOF |
配置Nginx日志策略
1 2 3 4 5 6 7 8 9 10 11 12 13 14 15 16 17 18 19 20 21 22 2324 | #修改客户端配置
vi /etc/logstash-forwarder.conf
{
"network": {
"servers": [ "elk.ooxx.com:5000" ],
"ssl ca": "/etc/pki/tls/certs/logstash-forwarder.crt",
"timeout": 15
},
"files": [
{
"paths": [
"/var/log/messages",
"/var/log/secure"
],
"fields": { "type": "syslog" }
}, {
"paths": [
"/app/local/nginx/logs/access.log"
],
"fields": { "type": "nginx" }
}
]
}
#服务端增加patterns
mkdir /opt/logstash/patterns
vi /opt/logstash/patterns/nginx
NGUSERNAME [a-zA-Z\.\@\-\+_%]+
NGUSER %{NGUSERNAME}
NGINXACCESS %{IPORHOST:remote_addr} - - \[%{HTTPDATE:time_local}\] "%{WORD:method} %{URIPATH:path}(?:%{URIPARAM:param})? HTTP/%{NUMBER:httpversion}" %{INT:status} %{INT:body_bytes_sent} %{QS:http_referer} %{QS:http_user_agent}
#官网pattern的debug在线工具 https://grokdebug.herokuapp.com/
#修改logstash权限
chown -R logstash:logstash /opt/logstash/patterns
#修改服务端配置
vi /etc/logstash/conf.d/01-logstash-initial.conf
input {
lumberjack {
port => 5000
type => "logs"
ssl_certificate => "/etc/pki/tls/certs/logstash-forwarder.crt"
ssl_key => "/etc/pki/tls/private/logstash-forwarder.key"
}
}
filter {
if [type] == "syslog" {
grok {
match => { "message" => "%{SYSLOGTIMESTAMP:syslog_timestamp} %{SYSLOGHOST:syslog_hostname} %{DATA:syslog_program}(?:\[%{POSINT:syslog_pid}\])?: %{GREEDYDATA:syslog_message}" }
add_field => [ "received_at", "%{@timestamp}" ]
add_field => [ "received_from", "%{host}" ]
}
syslog_pri { }
date {
match => [ "syslog_timestamp", "MMM d HH:mm:ss", "MMM dd HH:mm:ss" ]
}
}
if [type] == "nginx" {
grok {
match => { "message" => "%{NGINXACCESS}" }
}
}
}
output {
elasticsearch { host => localhost }
stdout { codec => rubydebug }
} |
其它注意事项
修改kibana端口
1 2 3 4 5 6 7 8 9 10 11 12 13 14 15 16 17 18 19 20 21 22 2324 | #编辑kibana.yaml vi /usr/local/kibana/config/kibana.yml # Kibana is served by a back end server. This controls which port to use. #port: 5601 port: 80 # The host to bind the server to. host: "0.0.0.0" # The Elasticsearch instance to use for all your queries. elasticsearch_url: "http://localhost:9200" # preserve_elasticsearch_host true will send the hostname specified in `elasticsearch`. If you set it to false, # then the host you use to connect to *this* Kibana instance will be sent. elasticsearch_preserve_host: true # Kibana uses an index in Elasticsearch to store saved searches, visualizations # and dashboards. It will create a new index if it doesn't already exist. kibana_index: ".kibana" # If your Elasticsearch is protected with basic auth, this is the user credentials # used by the Kibana server to perform maintence on the kibana_index at statup. Your Kibana # users will still need to authenticate with Elasticsearch (which is proxied thorugh # the Kibana server) # kibana_elasticsearch_username: user # kibana_elasticsearch_password: pass # If your Elasticsearch requires client certificate and key # kibana_elasticsearch_client_crt: /path/to/your/client.crt # kibana_elasticsearch_client_key: /path/to/your/client.key # If you need to provide a CA certificate for your Elasticsarech instance, put # the path of the pem file here. # ca: /path/to/your/CA.pem # The default application to load. default_app_id: "discover" # Time in milliseconds to wait for elasticsearch to respond to pings, defaults to # request_timeout setting # ping_timeout: 1500 # Time in milliseconds to wait for responses from the back end or elasticsearch. # This must be > 0 request_timeout: 300000 # Time in milliseconds for Elasticsearch to wait for responses from shards. # Set to 0 to disable. shard_timeout: 0 # Time in milliseconds to wait for Elasticsearch at Kibana startup before retrying # startup_timeout: 5000 # Set to false to have a complete disregard for the validity of the SSL # certificate. verify_ssl: true # SSL for outgoing requests from the Kibana Server (PEM formatted) # ssl_key_file: /path/to/your/server.key # ssl_cert_file: /path/to/your/server.crt # Set the path to where you would like the process id file to be created. # pid_file: /var/run/kibana.pid # If you would like to send the log output to a file you can set the path below. # This will also turn off the STDOUT log output. # log_file: ./kibana.log # Plugins that are included in the build, and no longer found in the plugins/ folder bundled_plugin_ids: - plugins/dashboard/index - plugins/discover/index - plugins/doc/index - plugins/kibana/index - plugins/markdown_vis/index - plugins/metric_vis/index - plugins/settings/index - plugins/table_vis/index - plugins/vis_types/index - plugins/visualize/index |
JVM调优
#修改elasticsearch.in.sh
vi /usr/share/elasticsearch/bin/elasticsearch.in.sh

if [ "x$ES_MIN_MEM" = "x" ]; then
ES_MIN_MEM=1g
fi
if [ "x$ES_MAX_MEM" = "x" ]; then
ES_MAX_MEM=1g

相关文章推荐
- Hibernate annotation多对多配置
- LeetCode 43 - Multiply Strings
- iOS字体相关知识
- volley获取网络图片,生成本地图片
- 计算机二进制
- Android的Native方式广播intent
- 技术url汇总
- 数据归一化的作用
- 北航航空学院飞机总体设计课程项目小组章程
- java 读取json
- oracle创建用户及赋权
- ACM刷题中高效求素数
- linux平台使用multipath配置asm磁盘(multipath path)
- nw.js node-webkit系列(16)可能会遇到的故障及故障排除
- php curl函数请求链接获得结果
- HTTP基本原理(http1.0与http1.1之区别)
- Content hugging和Content compression resistance
- HTML 样式
- tomcat 中部署的应用响应json数据乱码解决办法
- 18--26 面向对象程序设计22(创建一个原生的原型)