Python实现kMeans(k均值聚类)
2016-02-03 23:07
816 查看
Python实现kMeans(k均值聚类)
运行环境
Pyhton3numpy(科学计算包)
matplotlib(画图所需,不画图可不必)
计算过程
st=>start: 开始
e=>end: 结束
op1=>operation: 读入数据
op2=>operation: 随机初始化聚类中心
cond=>condition: 是否聚类是否变化
op3=>operation: 寻找最近的点加入聚类
op4=>operation: 更新聚类中心
op5=>operation: 输出结果

st->op1->op2->op3->op4->cond
cond(yes)->op3
cond(no)->op5->e
输入样例
/* 788points.txt */
15.55,28.65
14.9,27.55
14.45,28.35
14.15,28.8
13.75,28.05
13.35,28.45
13,29.15
13.45,27.5
13.6,26.5
12.8,27.35
12.4,27.85
12.3,28.4
12.2,28.65
13.4,25.1
12.95,25.95
788points.txt完整文件:下载
代码实现
# -*- coding: utf-8 -*-
__author__ = 'Wsine'
from numpy import *
import matplotlib.pyplot as plt
import operator
import time
INF = 9999999.0
def loadDataSet(fileName, splitChar='\t'):
"""
输入:文件名
输出:数据集
描述:从文件读入数据集
"""
dataSet = []
with open(fileName) as fr:
for line in fr.readlines():
curline = line.strip().split(splitChar)
fltline = list(map(float, curline))
dataSet.append(fltline)
return dataSet
def createDataSet():
"""
输出:数据集
描述:生成数据集
"""
dataSet = [[0.0, 2.0],
[0.0, 0.0],
[1.5, 0.0],
[5.0, 0.0],
[5.0, 2.0]]
return dataSet
def distEclud(vecA, vecB):
"""
输入:向量A, 向量B
输出:两个向量的欧式距离
"""
return sqrt(sum(power(vecA - vecB, 2)))
def randCent(dataSet, k):
"""
输入:数据集, 聚类个数
输出:k个随机质心的矩阵
"""
n = shape(dataSet)[1]
centroids = mat(zeros((k, n)))
for j in range(n):
minJ = min(dataSet[:, j])
rangeJ = float(max(dataSet[:, j]) - minJ)
centroids[:, j] = minJ + rangeJ * random.rand(k, 1)
return centroids
def kMeans(dataSet, k, distMeans=distEclud, createCent=randCent):
"""
输入:数据集, 聚类个数, 距离计算函数, 生成随机质心函数
输出:质心矩阵, 簇分配和距离矩阵
"""
m = shape(dataSet)[0]
clusterAssment = mat(zeros((m, 2)))
centroids = createCent(dataSet, k)
clusterChanged = True
while clusterChanged:
clusterChanged = False
for i in range(m): # 寻找最近的质心
minDist = INF
minIndex = -1
for j in range(k):
distJI = distMeans(centroids[j, :], dataSet[i, :])
if distJI < minDist:
minDist = distJI
minIndex = j
if clusterAssment[i, 0] != minIndex:
clusterChanged = True
clusterAssment[i, :] = minIndex, minDist**2
for cent in range(k): # 更新质心的位置
ptsInClust = dataSet[nonzero(clusterAssment[:, 0].A == cent)[0]]
centroids[cent, :] = mean(ptsInClust, axis=0)
return centroids, clusterAssment
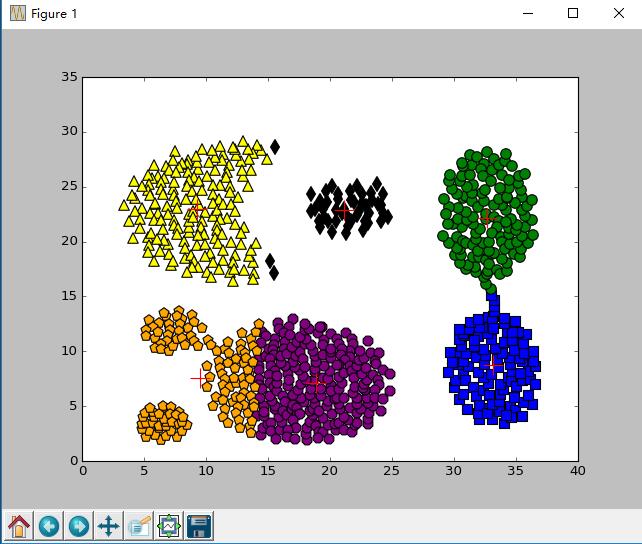
def plotFeature(dataSet, centroids, clusterAssment):
m = shape(centroids)[0]
fig = plt.figure()
scatterMarkers = ['s', 'o', '^', '8', 'p', 'd', 'v', 'h', '>', '<']
scatterColors = ['blue', 'green', 'yellow', 'purple', 'orange', 'black', 'brown']
ax = fig.add_subplot(111)
for i in range(m):
ptsInCurCluster = dataSet[nonzero(clusterAssment[:, 0].A == i)[0], :]
markerStyle = scatterMarkers[i % len(scatterMarkers)]
colorSytle = scatterColors[i % len(scatterColors)]
ax.scatter(ptsInCurCluster[:, 0].flatten().A[0], ptsInCurCluster[:, 1].flatten().A[0], marker=markerStyle, c=colorSytle, s=90)
ax.scatter(centroids[:, 0].flatten().A[0], centroids[:, 1].flatten().A[0], marker='+', c='red', s=300)
def main():
#dataSet = loadDataSet('testSet2.txt')
dataSet = loadDataSet('788points.txt', splitChar=',')
#dataSet = createDataSet()
dataSet = mat(dataSet)
resultCentroids, clustAssing = kMeans(dataSet, 6)
print('*******************')
print(resultCentroids)
print('*******************')
plotFeature(dataSet, resultCentroids, clustAssing)
if __name__ == '__main__':
start = time.clock()
main()
end = time.clock()
print('finish all in %s' % str(end - start))
plt.show()输出样例
*******************
[[ 33.14278846   8.79375   ]
[ 32.69453125  22.13789062]
[  9.25928144  22.98113772]
[ 18.8620283    7.11037736]
[  9.50503876   7.55620155]
[ 21.16041667  22.89895833]]
*******************
finish all in 5.454627327134057

相关文章推荐
- leetcode之Best Time to Buy and Sell Stock
- SAE: Python Django 如何 syncdb 到线上数据库
- Python与Qt UI的图形界面编程(三)
- Python与Qt UI的图形界面编程(二)
- Python 14.3 UDP编程
- Python与Qt UI的图形界面编程(一)
- 《笨办法学Python》 第32课手记
- Python实现SVM(支持向量机)
- Python开发简单爬虫(笔记)
- Python游戏引擎开发(五):Sprite精灵类和鼠标事件
- Python之set集合
- python小白-day5 time&datetime模块
- python-----读写操作
- Python+Django+SAE系列教程15-----输出非HTML内容(图片/PDF)
- Python学习二
- python3 随机数
- Python实现PLA(感知机)
- Python实现LR(逻辑回归)
- Python3.4爬虫编程
- Python实现CART(基尼指数)