用rvest包来抓取Google学术搜索数据
2016-01-12 00:00
609 查看
摘要: 在这篇文章,主要展示的是如何抓取Google学术网页。示例展示的是用rvest包来抓取作者博士指导老师的个人学术数据。我们可以看到他的合著者,论文被引用了多少次以及它们的附属机构。Hadley Wickham在RStudio Blog中写道:“rvest的灵感来源于类似beautiful soup这样可以轻易的从HTML网页抓取数据的一些库”。因为它被设计成跟magrittr一起使用。我们可以通过一些简单和易于理解的代码块组成的管道操作来表示复杂的操作。
在这篇文章,主要展示的是如何抓取Google学术网页。示例展示的是用
加载R包:
用
在
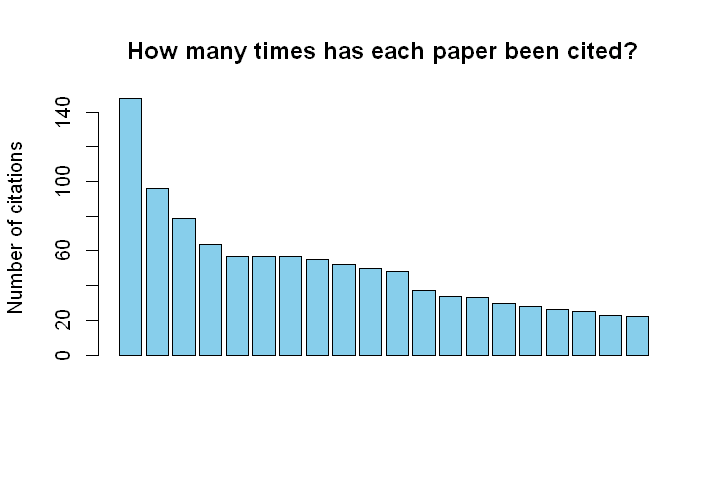
查看引用此次数:
绘制引用次数的条形图:
查看下合著者
截止到2016年1月1日,他的合著者共有27人。
他的合著者被引用了多少次?
通过全局替代提取数值字符串
将字符串转成数值型,再得到
创建一个由coauthors,citations和affiliation组成的数据框
根据引用次数,对合著者重新排序
根据引用次数对合著者重新排序,以便得到递减的顺序图:

与他合著的科学家中,有引用超过了12000次。他的学生中像我(图中最后一个)这样的刚处在"学走路的阶段"。
正如我们在这篇文章所看到的一样,利用
修正:我的导师告诉我Google学术只收录了他的小部分合著者。跟他合作发表的一些科学家以及一些引用很多次文章并没有显示出来。进一步,上面得到的结果对于有些人来说是不符合常理的(如:资历更深的人发表了更多的文章却比资历浅的人引用的次数更少)。因此,Google学术数据应该谨慎使用。
本文由雪晴数据网负责翻译整理,原文请参考Google scholar scraping with rvest package作者Fisseha Berhane。转载请注明原文链接http://www.xueqing.cc/cms/article/109
在这篇文章,主要展示的是如何抓取Google学术网页。示例展示的是用
rvest包来抓取作者博士指导老师的个人学术数据。我们可以看到他的合著者,论文被引用了多少次以及它们的附属机构。Hadley Wickham在RStudio Blog中写道:“
rvest的灵感来源于类似beautiful soup这样可以轻易的从HTML网页抓取数据的一些库”。因为它被设计成跟magrittr一起使用。我们可以通过一些简单和易于理解的代码块组成的管道操作来表示复杂的操作。
加载R包:
用
ggplot2包来作图
library(rvest)
library(ggplot2)
他的论文被引用了多少次?
使用SelectorGadget的CSS选择器来找出"cited by"列。page <- read_html("https://scholar.google.com/citations?user=sTR9SIQAAAAJ&hl=en&oi=ao")在
html_nodes()中指定CSS选择器,
html_text()用来提取文本。最后,用
as.numernic()将字符串类型转换为数值类型。
citations <- page %>% html_nodes ("#gsc_a_b .gsc_a_c") %>% html_text()%>%as.numeric()查看引用此次数:
citations
148 96 79 64 57 57 57 55 52 50 48 37 34 33 30 28 26 25 23 22
绘制引用次数的条形图:
barplot(citations, main="How many times has each paper been cited?", ylab='Number of citations', col="skyblue", xlab="")
合著者,他们的附属单位以及被引用的次数
同样,我们使用SelecotGadget的CSS选择器来找出匹配的合著者:page <- read_html("https://scholar.google.com/citations?view_op=list_colleagues&hl=en&user=sTR9SIQAAAAJ")
Coauthors = page%>% html_nodes(css=".gsc_1usr_name a") %>% html_text()
Coauthors = as.data.frame(Coauthors)
names(Coauthors)='Coauthors'查看下合著者
head(Coauthors)
Coauthors
1               Jason Evans
2             Mutlu Ozdogan
3            Rasmus Houborg
4          M. Tugrul Yilmaz
5 Joseph A. Santanello, Jr.
6              Seth Guikema

dim(Coauthors)
[1] 27  1
截止到2016年1月1日,他的合著者共有27人。
他的合著者被引用了多少次?
page <- read_html("https://scholar.google.com/citations?view_op=list_colleagues&hl=en&user=sTR9SIQAAAAJ")
citations = page%>% html_nodes(css = ".gsc_1usr_cby")%>%html_text()

citations
[1] "Cited by 2231"  "Cited by 1273"  "Cited by 816"   "Cited by 395"   "Cited by 652"   "Cited by 1531"
[7] "Cited by 674"   "Cited by 467"   "Cited by 7967"  "Cited by 3968"  "Cited by 2603"  "Cited by 3468"
[13] "Cited by 3175"  "Cited by 121"   "Cited by 32"    "Cited by 469"   "Cited by 50"    "Cited by 11"
[19] "Cited by 1187"  "Cited by 1450"  "Cited by 12407" "Cited by 1939"  "Cited by 9"     "Cited by 706"
[25] "Cited by 336"   "Cited by 186"   "Cited by 192"
通过全局替代提取数值字符串
citations = gsub('Cited by','', citations)

citations
[1] " 2231"  " 1273"  " 816"   " 395"   " 652"   " 1531"  " 674"   " 467"   " 7967"  " 3968"  " 2603"  " 3468"  " 3175"
[14] " 121"   " 32"    " 469"   " 50"    " 11"    " 1187"  " 1450"  " 12407" " 1939"  " 9"     " 706"   " 336"   " 186"
[27] " 192"
将字符串转成数值型,再得到
ggplot2可用的数据框格式:
citations = as.numeric(citations)
citations = as.data.frame(citations)
合著者的附属机构
page <- read_html("https://scholar.google.com/citations?view_op=list_colleagues&hl=en&user=sTR9SIQAAAAJ")
affilation = page %>% html_nodes(css = ".gsc_1usr_aff")%>%html_text()
affilation = as.data.frame(affilation)
names(affilation)='Affilation'
创建一个由coauthors,citations和affiliation组成的数据框
cauthors=cbind(Coauthors, citations, affilation)

cauthors
Coauthors citations                                                                                  Affilation
1                          Jason Evans      2231                                                               University of New South Wales
2                        Mutlu Ozdogan      1273    Assistant Professor of Environmental Science and Forest Ecology, University of Wisconsin
3                       Rasmus Houborg       816                    Research Scientist at King Abdullah University of Science and Technology
4                     M. Tugrul Yilmaz       395 Assistant Professor, Civil Engineering Department, Middle East Technical University, Turkey
5            Joseph A. Santanello, Jr.       652                                                  NASA-GSFC Hydrological Sciences Laboratory
.....
根据引用次数,对合著者重新排序
根据引用次数对合著者重新排序,以便得到递减的顺序图:
cauthors$Coauthors <- factor(cauthors$Coauthors, levels = cauthors$Coauthors[order(cauthors$citations, decreasing=F)])

ggplot(cauthors,aes(Coauthors,citations))+geom_bar(stat="identity", fill="#ff8c1a",size=5)+
theme(axis.title.y   = element_blank())+ylab("# of citations")+
theme(plot.title=element_text(size = 18,colour="blue"), axis.text.y = element_text(colour="grey20",size=12))+
ggtitle('Citations of his coauthors')+coord_flip()
与他合著的科学家中,有引用超过了12000次。他的学生中像我(图中最后一个)这样的刚处在"学走路的阶段"。
总结
在这篇文章,我们看到了如何抓取Google学术数据。我抓取了我导师的账户,获得了论文引用次数数据,合著者的附属机构以及他们被引用的次数。正如我们在这篇文章所看到的一样,利用
rvest包可以很容易的抓取HTML网页数据。同样重要的是,SelectorGadget通过CSS选择器可以帮助我们找出感兴趣的数据。
修正:我的导师告诉我Google学术只收录了他的小部分合著者。跟他合作发表的一些科学家以及一些引用很多次文章并没有显示出来。进一步,上面得到的结果对于有些人来说是不符合常理的(如:资历更深的人发表了更多的文章却比资历浅的人引用的次数更少)。因此,Google学术数据应该谨慎使用。
本文由雪晴数据网负责翻译整理,原文请参考Google scholar scraping with rvest package作者Fisseha Berhane。转载请注明原文链接http://www.xueqing.cc/cms/article/109

相关文章推荐
- Point in polygon algorithm C code
- 06.Django中用户的两种扩展方式(Profile和AbstractUser)
- 05.Django表单的使用
- 蓝桥杯 ALGO-92 前缀表达式
- 蓝桥杯 ALGO-97 排序
- DragonBones使用
- google map 麻点图实现方法 源码
- leangoo,不容小觑的协作工具
- go bytes缓冲区使用介绍
- Golang初级系列教程-Struct
- golang esl api
- 使用google地图绘画轨迹
- ros_indigo使用keyboard键盘控制虚拟或实际机器人
- ros_indigo使用keyboard键盘控制虚拟或实际机器人
- ros_indigo使用keyboard键盘控制虚拟或实际机器人
- mac下用eclipse搭建go语言开发环境
- 在mac系统安装go语言以及配置
- Django开发博客(六)——添加markdown支持
- django学习笔记1--django的安装与工程创建
- 蓝桥杯 ALGO-101 图形显示