htop,dstat,top,ps命令的使用
2016-01-02 15:55
741 查看
ps命令:
ps - report a snapshot of the currentprocesses. ps [options]: 选项有三种风格: 1 UNIX options, which may be grouped and mustbe preceded by a dash.
2 BSD options, which may be grouped and must not be used with a dash.
3 GNU long options, which are preceded by two dashes.
启动进程的方式:
系统启动过程中自动启动:与终端无关的进程;
用户通过终端启动:与终端相关的进程;
选项:
a:所有与终端相关的进程;
x:所有与终端无关的进程;
u:以用户为中心组织进程状态信息显示;
常用组合之一:aux
RSS:常驻内存集; TTY:终端ID;
STAT:进程状态,如下:
R:正在运行中(running)
S:可中断睡眠(interruptablesleeping)
D:不可中断睡眠(uninterruptablesleeping)
T:停止状态(Stopped)
Z:僵死状态(zombie)
+:前台进程
l:多线程进程
N:低优先级进程
<:高优先级进程
s:存在子进程的父进程
START:启动进程的时间
TIME:进程消耗CPU的时间
COMMAND命令的名称和参数
例: 1. 可以用 | 管道和 more 连接起来分页查看 命令: ps aux | more
2. 把所有进程显示出来,并输出到ps001.txt文件 命令: ps aux > ps1.txt
-e:显示所有进程
-f:显示完整格式的进程信息
常用组合之二:-ef
-F:显示完整格式的进程信息;
C: cpuutilization
PSR:运行于哪颗CPU之上
-H:以层级结构显示进程的相关信息;
常用组合之三:-eFH
常用组合之四:-eo, axo
用来输出指定的字段;
o field1, field2,...:自定义要显示的字段列表,以逗号分隔;
常用的field:pid, ni,pri, psr, pcpu, stat, comm, tty, ppid, rtprio
ni:nice值;
priority:priority, 优先级;
rtprio:real timepriority,实时优先
例: ps axo pid,ni,session,priority,comm
dstat命令:性能检测工具
默认选项:-c(cpu),-d(disk),-n(net),-g(page),-y(system)
常用选项:
-c, --cpu:显示cpu相关信息;
-C #,#,...,total
-d, --disk:显示磁盘的相关信息
-D sda,sdb,...,total
-g:显示page相关的速率数据;
-m:Memory的相关统计数据
-n:Interface的相关统计数据;
-p:显示process的相关统计数据;
-r:显示io请求的相关的统计数据;
-s:显示swapped的相关统计数据;
--tcp:显示常用的TCP统计
--udp:显示监听的UDP接口及其当前用量的一些动态数据
--raw:显示raw的统计数据
--socket:显示网络统计数据
--ipc:报告IPC消息队列和信号量的使用情况
--top-cpu:显示最占用CPU的进程;
--top-io:最占用io的进程;
--top-mem:最占用内存的进程;
--top-lantency:延迟最大的进程;
top命令:
top命令用来动态监控系统处理器的状态;
过去1分钟、5分钟和15分钟的平均负载;等待运行的进程队列的长度; 2. 第二、三行为进程和CPU的信息
3. 第四五行为内存信息。
进程信息:
PR:优先级
NI:nice值,负值表示高优先级,正值表示低优先级
VIRT:进程使用的虚拟内存总量
RES:进程使用的、未被换出的物理内存大小
SHR:共享内存大小
排序:
P:以占据CPU百分比排序;
M:以占据内存百分比排序;
T:累积占用CPU时间排序;
首部信息:
uptime信息:l命令
tasks及cpu信息:t命令
内存信息:m命令
退出命令:q
修改刷新时间间隔:s
终止指定的进程:k
选项:
-d #:指定刷新时间间隔,默认为3秒;
-b:以批次方式显示;
-n #:显示多少批次;
htop命令:
类似于 top 命令,但可以让你在垂直和水平方向上滚动,所以你可以看到系统上运行的所有进程,以及他们完整的命令行
选项:
-d #:指定延迟时间间隔;例如,htop -d 100命令会使输出在1秒后才会刷新(参数单位是10微秒)。
-u UserName:仅显示指定用户的进程;例htop -u gadoop命令会只显示出用户名为 hadoop的相关进程。
-s COLUME:以指定字段进行排序;例htop -s PID命令会按PID列的大小排序显示。
子命令:
l:显示选定的进程打开的文件列表;
s:跟踪选定的进程的系统调用;
t:以层级关系显示各进程状态;
a:将选定的进程绑定至某指定的CPU核心;
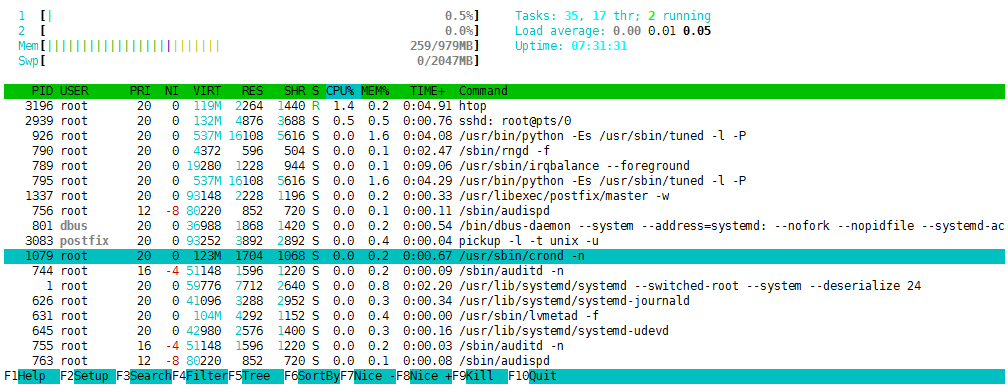
通过F1[help]来切换至帮助页面:

可以使用F5来查看进程的树状图:

退出则再按一下F5;
我们可以使用F1-F10以及帮助页面的命令来对当前系统上的进程进行查看和编辑。
ps - report a snapshot of the currentprocesses. ps [options]: 选项有三种风格: 1 UNIX options, which may be grouped and mustbe preceded by a dash.
2 BSD options, which may be grouped and must not be used with a dash.
3 GNU long options, which are preceded by two dashes.
启动进程的方式:
系统启动过程中自动启动:与终端无关的进程;
用户通过终端启动:与终端相关的进程;
选项:
a:所有与终端相关的进程;
x:所有与终端无关的进程;
u:以用户为中心组织进程状态信息显示;
常用组合之一:aux
[root@localhost ~]# ps aux
USER        PID %CPU %MEM    VSZ   RSS TTY      STAT START   TIME COMMAND
root          1  0.0  0.7  59776  7712 ?        Ss   1月01   0:02 /usr/lib/systemd/system
root          2  0.0  0.0      0     0 ?        S    1月01   0:00 [kthreadd]
root          3  0.0  0.0      0     0 ?        S    1月01   0:00 [ksoftirqd/0]
root          5  0.0  0.0      0     0 ?        S<   1月01   0:00 [kworker/0:0H]
root          6  0.0  0.0      0     0 ?        S    1月01   0:00 [kworker/u256:0]
root          7  0.0  0.0      0     0 ?        S    1月01   0:00 [migration/0]
root          8  0.0  0.0      0     0 ?        S    1月01   0:00 [rcu_bh]
root          9  0.0  0.0      0     0 ?        S    1月01   0:00 [rcuob/0]
root         10  0.0  0.0      0     0 ?        S    1月01   0:00 [rcuob/1]
root         11  0.0  0.0      0     0 ?        S    1月01   0:00 [rcuob/2]
root         12  0.0  0.0      0     0 ?        S    1月01   0:00 [rcuob/3]
root         13  0.0  0.0      0     0 ?        S    1月01   0:00 [rcuob/4]
root         14  0.0  0.0      0     0 ?        S    1月01   0:00 [rcuob/5]
VSZ:虚拟内存集;
RSS:常驻内存集; TTY:终端ID;
STAT:进程状态,如下:
R:正在运行中(running)
S:可中断睡眠(interruptablesleeping)
D:不可中断睡眠(uninterruptablesleeping)
T:停止状态(Stopped)
Z:僵死状态(zombie)
+:前台进程
l:多线程进程
N:低优先级进程
<:高优先级进程
s:存在子进程的父进程
START:启动进程的时间
TIME:进程消耗CPU的时间
COMMAND命令的名称和参数
例: 1. 可以用 | 管道和 more 连接起来分页查看 命令: ps aux | more
2. 把所有进程显示出来,并输出到ps001.txt文件 命令: ps aux > ps1.txt
-e:显示所有进程
-f:显示完整格式的进程信息
常用组合之二:-ef
[root@localhost ~]# ps -ef
UID         PID   PPID  C STIME TTY          TIME CMD
root          1      0  0 1月01 ?       00:00:02 /usr/lib/systemd/systemd --switched-root --sy
root          2      0  0 1月01 ?       00:00:00 [kthreadd]
root          3      2  0 1月01 ?       00:00:00 [ksoftirqd/0]
root          5      2  0 1月01 ?       00:00:00 [kworker/0:0H]
root          6      2  0 1月01 ?       00:00:00 [kworker/u256:0]
root          7      2  0 1月01 ?       00:00:00 [migration/0]
root          8      2  0 1月01 ?       00:00:00 [rcu_bh]
root          9      2  0 1月01 ?       00:00:00 [rcuob/0]
root         10      2  0 1月01 ?       00:00:00 [rcuob/1]
root         11      2  0 1月01 ?       00:00:00 [rcuob/2]
root         12      2  0 1月01 ?       00:00:00 [rcuob/3]
root         13      2  0 1月01 ?       00:00:00 [rcuob/4]
root         14      2  0 1月01 ?       00:00:00 [rcuob/5]
root         15      2  0 1月01 ?       00:00:00 [rcuob/6]
root         16      2  0 1月01 ?       00:00:00 [rcuob/7]
root         17      2  0 1月01 ?       00:00:00 [rcuob/8]
root         18      2  0 1月01 ?       00:00:00 [rcuob/9]
root         19      2  0 1月01 ?       00:00:00 [rcuob/10]
-F:显示完整格式的进程信息;
C: cpuutilization
PSR:运行于哪颗CPU之上
-H:以层级结构显示进程的相关信息;
常用组合之三:-eFH
[root@localhost ~]# ps -eFH
UID         PID   PPID  C    SZ   RSS PSR STIME TTY          TIME CMD
root          2      0  0     0     0   0 1月01 ?       00:00:00 [kthreadd]
root          3      2  0     0     0   0 1月01 ?       00:00:00   [ksoftirqd/0]
root          5      2  0     0     0   0 1月01 ?       00:00:00   [kworker/0:0H]
root          6      2  0     0     0   0 1月01 ?       00:00:00   [kworker/u256:0]
root          7      2  0     0     0   0 1月01 ?       00:00:00   [migration/0]
root          8      2  0     0     0   0 1月01 ?       00:00:00   [rcu_bh]
root          9      2  0     0     0   0 1月01 ?       00:00:00   [rcuob/0]
root         10      2  0     0     0   0 1月01 ?       00:00:00   [rcuob/1]
root         11      2  0     0     0   0 1月01 ?       00:00:00   [rcuob/2]
root         12      2  0     0     0   0 1月01 ?       00:00:00   [rcuob/3]
root         13      2  0     0     0   0 1月01 ?       00:00:00   [rcuob/4]
root         14      2  0     0     0   0 1月01 ?       00:00:00   [rcuob/5]
root         15      2  0     0     0   0 1月01 ?       00:00:00   [rcuob/6]
root         16      2  0     0     0   0 1月01 ?       00:00:00   [rcuob/7]
root         17      2  0     0     0   0 1月01 ?       00:00:00   [rcuob/8]
root         18      2  0     0     0   0 1月01 ?       00:00:00   [rcuob/9]
root         19      2  0     0     0   0 1月01 ?       00:00:00   [rcuob/10]
常用组合之四:-eo, axo
用来输出指定的字段;
o field1, field2,...:自定义要显示的字段列表,以逗号分隔;
常用的field:pid, ni,pri, psr, pcpu, stat, comm, tty, ppid, rtprio
ni:nice值;
priority:priority, 优先级;
rtprio:real timepriority,实时优先
例: ps axo pid,ni,session,priority,comm
[root@localhost tmp]# ps axo pid,ni,session,priority,comm
PID  NI   SESS PRI  COMMAND
1   0      1  20  systemd
2   0      0  20  kthreadd
3   0      0  20  ksoftirqd/0
5 -20      0   0  kworker/0:0H
6   0      0  20  kworker/u256:0
7   -      0 -100 migration/0
8   0      0  20  rcu_bh
9   0      0  20  rcuob/0
10   0      0  20  rcuob/1
dstat命令:性能检测工具
默认选项:-c(cpu),-d(disk),-n(net),-g(page),-y(system)
[root@localhost tmp]# dstat
You did not select any stats, using -cdngy by default.
----total-cpu-usage---- -dsk/total- -net/total- ---paging-- ---system--
usr sys idl wai hiq siq| read  writ| recv  send|  in   out | int   csw
0   0 100   0   0   0|6399B  801B|   0     0 |   0     0 |  23    28
0   0 100   0   0   0|   0     0 | 152B  826B|   0     0 |  24    24
0   0 100   0   0   0|   0     0 |  60B  346B|   0     0 |  29    38
0   0 100   0   0   0|   0     0 |  60B  346B|   0     0 |  19    19
0   1 100   0   0   0|   0     0 |  60B  346B|   0     0 |  17    19
0   0 100   0   0   0|   0     0 |  60B  346B|   0     0 |  18    20
常用选项:
-c, --cpu:显示cpu相关信息;
-C #,#,...,total
-d, --disk:显示磁盘的相关信息
-D sda,sdb,...,total
-g:显示page相关的速率数据;
-m:Memory的相关统计数据
-n:Interface的相关统计数据;
-p:显示process的相关统计数据;
-r:显示io请求的相关的统计数据;
-s:显示swapped的相关统计数据;
--tcp:显示常用的TCP统计
--udp:显示监听的UDP接口及其当前用量的一些动态数据
--raw:显示raw的统计数据
--socket:显示网络统计数据
--ipc:报告IPC消息队列和信号量的使用情况
--top-cpu:显示最占用CPU的进程;
--top-io:最占用io的进程;
--top-mem:最占用内存的进程;
--top-lantency:延迟最大的进程;
top命令:
top命令用来动态监控系统处理器的状态;
[root@localhost tmp]# top
top - 03:11:55 up  7:08,  3 users,  load average: 0.00, 0.01, 0.05
Tasks: 366 total,   1 running, 365 sleeping,   0 stopped,   0 zombie
%Cpu(s):  0.0 us,  0.2 sy,  0.0 ni, 99.8 id,  0.0 wa,  0.0 hi,  0.0 si,  0.0 st
KiB Mem :  1003184 total,   620060 free,   155640 used,   227484 buff/cache
KiB Swap:  2097148 total,  2097148 free,        0 used.   650604 avail Mem

PID USER      PR  NI    VIRT    RES    SHR S  %CPU %MEM     TIME+ COMMAND
2939 root      20   0  135212   4876   3688 S   0.3  0.5   0:00.47 sshd
1 root      20   0   59776   7712   2640 S   0.0  0.8   0:02.17 systemd
2 root      20   0       0      0      0 S   0.0  0.0   0:00.06 kthreadd
1. 第一行是任务队列信息,同 uptime命令:显示系统时间、运行时长及平均负载;
过去1分钟、5分钟和15分钟的平均负载;等待运行的进程队列的长度; 2. 第二、三行为进程和CPU的信息
3. 第四五行为内存信息。
进程信息:
PR:优先级
NI:nice值,负值表示高优先级,正值表示低优先级
VIRT:进程使用的虚拟内存总量
RES:进程使用的、未被换出的物理内存大小
SHR:共享内存大小
排序:
P:以占据CPU百分比排序;
M:以占据内存百分比排序;
T:累积占用CPU时间排序;
首部信息:
uptime信息:l命令
tasks及cpu信息:t命令
内存信息:m命令
退出命令:q
修改刷新时间间隔:s
终止指定的进程:k
选项:
-d #:指定刷新时间间隔,默认为3秒;
-b:以批次方式显示;
-n #:显示多少批次;
[root@localhost tmp]# top -d 1 -n 3 -b
htop命令:
类似于 top 命令,但可以让你在垂直和水平方向上滚动,所以你可以看到系统上运行的所有进程,以及他们完整的命令行
选项:
-d #:指定延迟时间间隔;例如,htop -d 100命令会使输出在1秒后才会刷新(参数单位是10微秒)。
-u UserName:仅显示指定用户的进程;例htop -u gadoop命令会只显示出用户名为 hadoop的相关进程。
-s COLUME:以指定字段进行排序;例htop -s PID命令会按PID列的大小排序显示。
子命令:
l:显示选定的进程打开的文件列表;
s:跟踪选定的进程的系统调用;
t:以层级关系显示各进程状态;
a:将选定的进程绑定至某指定的CPU核心;
通过F1[help]来切换至帮助页面:
可以使用F5来查看进程的树状图:
退出则再按一下F5;
我们可以使用F1-F10以及帮助页面的命令来对当前系统上的进程进行查看和编辑。

相关文章推荐
- Hegemon:使用 Rust 编写的模块化系统监视程序
- mysql 前几条记录语句之(limit)
- top、clientTop、scrollTop、offsetTop
- 使用 TOP 子句限制UPDATE 语句更新的数据
- asp中 select top 问题!~
- 关于js中window.location.href,location.href,parent.location.href,top.location.href的用法与区别
- js中top的作用深入剖析
- JS window对象的top、parent、opener含义介绍
- js中不同的height, top的区别对比
- Linux Top 命令解析
- 国外正流行的不常见Linux发行版简介
- linux top命令查看内存及多核CPU的使用讲述 [转]
- JVM的监控与优化
- mssql server利用top分页
- linux学习笔记:dstat命令详解
- Linux top 命令详解
- linux top命令详解
- htop 使用
- Linux 指令篇:工作行程资讯与管理--top
- Linux 终端下 dstat 监控工具