NetHogs - Monitor Per Process Network Bandwidth Usage in Real Time
2015-11-03 14:24
405 查看
原文链接:http://www.tecmint.com/nethogs-monitor-per-process-network-bandwidth-usage-in-real-time/
Linux operating systems have tons of open source network monitoring tools on the web. Say, you can use iftop
command to check bandwidth usage, netstat
command to see reports on interface statistics or top
command to watch running process on your system. But if you are really looking for something that can give you a real time statistics
of your network bandwidth of per process usage, then NetHogsis
the only utility you should look for.
NetHogs is an open source command line program (similar
to Linux top command) that is used for monitor real
time network traffic bandwidth used by each process or application.
From NetHogs Project Page
NetHogs is a small ‘net top’ tool. Instead of breaking the traffic down per protocol or per subnet, like most tools do, it groups bandwidth by process. NetHogs does not rely on a special kernel module to be loaded. If there’s suddenly a lot of network traffic,
you can fire up NetHogs and immediately see which PID is causing this. This makes it easy to identify programs that have gone wild and are suddenly taking up your bandwidth.
This article explains you on how to install and find out real time per process network bandwidth usage with nethogs utility
under Unix/Linux operating systems.
To install nethogs, you must turn
on EPEL repository under your Linux systems and then run the following yum
command to download and install nethogs package.
Sample Output
To install nethogs, type the following apt-get command
to install nethogs package.
Sample Output
To run the nethogs utility, type the following command under red-hat based systems.
To execute it, you will must have root permissions, so run with sudo command
as shown.
Sample Previews:
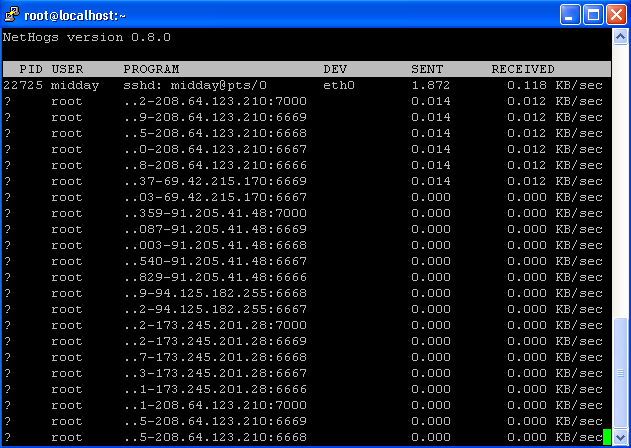
NetHogs Preview on CentOS 6.3
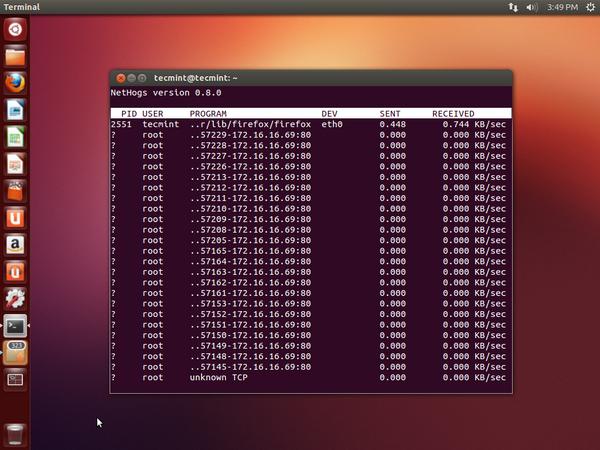
NetHogs Preview on Ubuntu 12.10
As you see above the send and received lines
show the amount of traffic being used by per process. The total sent and received usage
of bandwidth calculated at the bottom. You can sort and change the order by using the interactive controls discussed below.
Following are the nethogs command line options. Using
‘-d‘ to add a refresh rate and ‘device
name‘ to monitor specific given device or devices bandwidth (default is eth0).
For example, to set 5 seconds as your refresh rate,
then type the command as.
To monitor specific device (eth0) network bandwidth
only, use the command as.
To monitor network bandwidth of both eth0 and eth1 interfaces,
type the following command.
Other Options and Usage
Following are some useful interactive controls (Keyboard
Shortcuts) of nethogs program.
For a full list of nethogs utility command line options,
please check out the nethogs man pages by using command as ‘man
nethogs‘ or ‘sudo man nethogs‘ from the terminal.
For more information visit theNethogs
project home page.
Linux operating systems have tons of open source network monitoring tools on the web. Say, you can use iftop
command to check bandwidth usage, netstat
command to see reports on interface statistics or top
command to watch running process on your system. But if you are really looking for something that can give you a real time statistics
of your network bandwidth of per process usage, then NetHogsis
the only utility you should look for.
What is NetHogs?
NetHogs is an open source command line program (similarto Linux top command) that is used for monitor real
time network traffic bandwidth used by each process or application.
From NetHogs Project Page
NetHogs is a small ‘net top’ tool. Instead of breaking the traffic down per protocol or per subnet, like most tools do, it groups bandwidth by process. NetHogs does not rely on a special kernel module to be loaded. If there’s suddenly a lot of network traffic,
you can fire up NetHogs and immediately see which PID is causing this. This makes it easy to identify programs that have gone wild and are suddenly taking up your bandwidth.
This article explains you on how to install and find out real time per process network bandwidth usage with nethogs utility
under Unix/Linux operating systems.
Install NetHogs in RHEL, CentOS and Fedora
To install nethogs, you must turnon EPEL repository under your Linux systems and then run the following yum
command to download and install nethogs package.
# yum install nethogs
Sample Output
[root@tecmint ~]# yum -y install nethogs

Loaded plugins: fastestmirror, refresh-packagekit
Loading mirror speeds from cached hostfile
* base: mirrors.hns.net.in
* epel: mirror.nus.edu.sg
* extras: mirrors.hns.net.in
* rpmfusion-free-updates: mirrors.ustc.edu.cn
* rpmfusion-nonfree-updates: mirror.de.leaseweb.net
* updates: mirrors.hns.net.in
Setting up Install Process
Resolving Dependencies
--> Running transaction check
---> Package nethogs.i686 0:0.8.0-1.el6 will be installed
--> Finished Dependency Resolution

Dependencies Resolved

===========================================================================================================
Package				Arch				Version					Repository					Size
===========================================================================================================
Installing:
nethogs				i686				0.8.0-1.el6				epel						28 k

Transaction Summary
===========================================================================================================
Install       1 Package(s)

Total download size: 28 k
Installed size: 50 k
Downloading Packages:
nethogs-0.8.0-1.el6.i686.rpm														|  28 kB     00:00
Running rpm_check_debug
Running Transaction Test
Transaction Test Succeeded
Running Transaction
Installing : nethogs-0.8.0-1.el6.i686                                                          1/1
Verifying  : nethogs-0.8.0-1.el6.i686                                                          1/1

Installed:
nethogs.i686 0:0.8.0-1.el6

Complete!
Install NetHogs in Ubuntu, Linux Mint and Debian
To install nethogs, type the following apt-get commandto install nethogs package.
$ sudo apt-get install nethogs
Sample Output
tecmint@tecmint:~$ sudo apt-get install nethogs

[sudo] password for tecmint:
Reading package lists... Done
Building dependency tree
Reading state information... Done
The following NEW packages will be installed:
nethogs
0 upgraded, 1 newly installed, 0 to remove and 318 not upgraded.
Need to get 27.1 kB of archives.
After this operation, 100 kB of additional disk space will be used.
Get:1 http://in.archive.ubuntu.com/ubuntu/ quantal/universe nethogs i386 0.8.0-1 [27.1 kB]
Fetched 27.1 kB in 1s (19.8 kB/s)
Selecting previously unselected package nethogs.
(Reading database ... 216058 files and directories currently installed.)
Unpacking nethogs (from .../nethogs_0.8.0-1_i386.deb) ...
Processing triggers for man-db ...
Setting up nethogs (0.8.0-1) ...
Using NetHogs Utility
To run the nethogs utility, type the following command under red-hat based systems.# nethogs
To execute it, you will must have root permissions, so run with sudo command
as shown.
$ sudo nethogs
Sample Previews:
NetHogs Preview on CentOS 6.3
NetHogs Preview on Ubuntu 12.10
As you see above the send and received lines
show the amount of traffic being used by per process. The total sent and received usage
of bandwidth calculated at the bottom. You can sort and change the order by using the interactive controls discussed below.
NetHogs Command Line Options
Following are the nethogs command line options. Using‘-d‘ to add a refresh rate and ‘device
name‘ to monitor specific given device or devices bandwidth (default is eth0).
For example, to set 5 seconds as your refresh rate,
then type the command as.
# nethogs -d 5
$ sudo nethogs -d 5
To monitor specific device (eth0) network bandwidth
only, use the command as.
# nethogs eth0
$ sudo nethogs eth0
To monitor network bandwidth of both eth0 and eth1 interfaces,
type the following command.
# nethogs eth0 eth1
$ sudo nethogs eth0 eth1
Other Options and Usage
-d : delay for refresh rate.
-h : display available commands usage.
-p : sniff in promiscious mode (not recommended).
-t : tracemode.
-V : prints Version info.
NetHogs Interactive Controls
Following are some useful interactive controls (KeyboardShortcuts) of nethogs program.
-m : Change the units displayed for the bandwidth in units like KB/sec -> KB -> B-> MB.
-r : Sort by magnitude of respectively traffic.
-s : Sort by magnitude of sent traffic.
-q : Hit quit to the shell prompt.
For a full list of nethogs utility command line options,
please check out the nethogs man pages by using command as ‘man
nethogs‘ or ‘sudo man nethogs‘ from the terminal.
For more information visit theNethogs
project home page.

相关文章推荐
- java.lang.ThreadGroup.enumerate
- ios app的真机调试与发布配置
- EasyUI ComboBox应用示例
- ios开发实用快捷键
- Bitmap那些事(3)
- 关于JSON数据格式返回时间数据格式化问题
- Qtcreator4.8+Ubuntu14.04 fcitx无法输入中文
- 关于 @synchronized 理解
- [GRYZ2015]工业时代
- CSS3之过渡Transition
- hdu3591The trouble of Xiaoqian【多重背包】
- 详解Swift编程中的常量和变量
- Android学习—计算器实现
- PHP常用函数
- 水管总阀门开关诀窍
- PHP网站验证码不显示
- Java 处理word文档后在前端展示
- 代理---代理---代理(这也把问题说清楚了,不过某些命名不是很规范)
- Nand flash uboot 命令详解
- git 免登录 文件