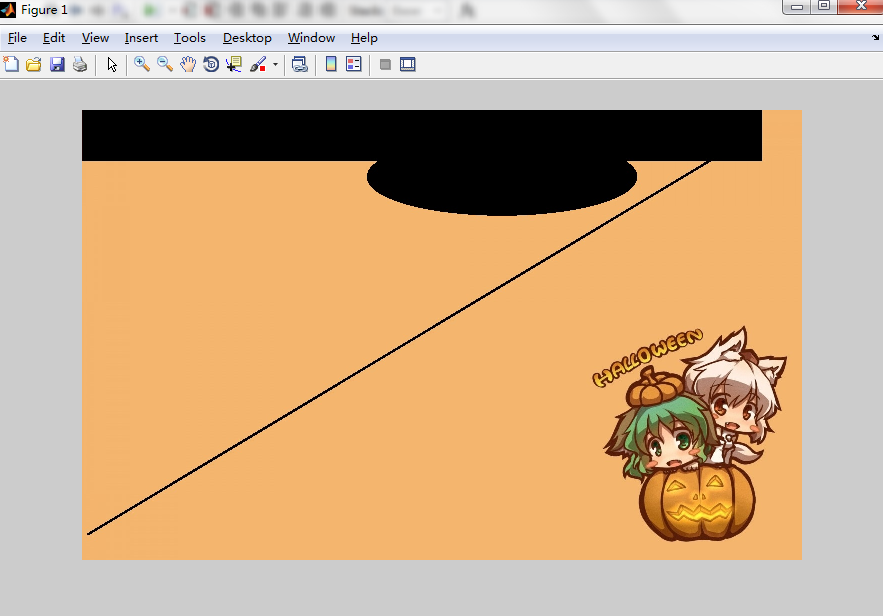
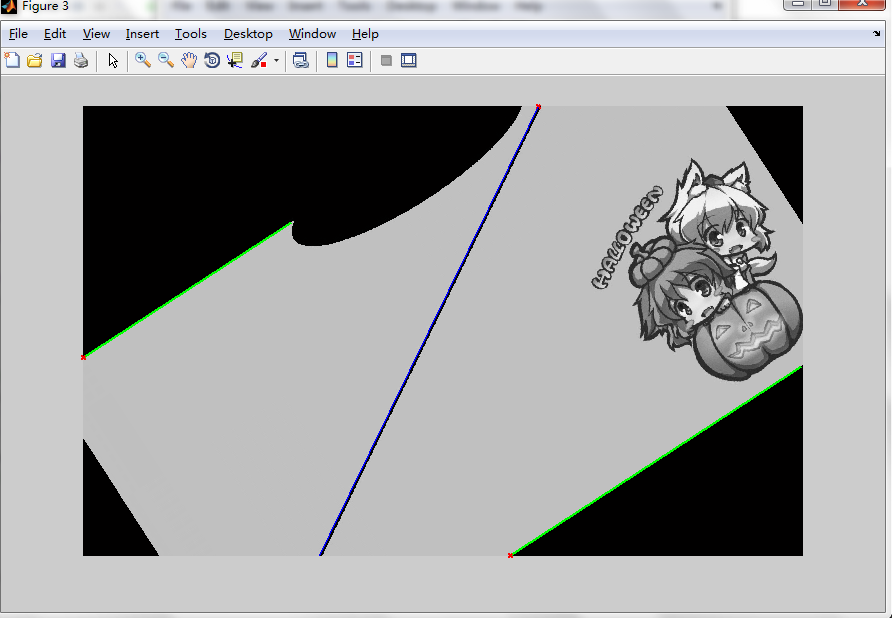
检测出图片中的直线且标记出图片中的最长线段
2015-11-01 17:50
288 查看
clc;
clear all;
I=imread('test.jpg');
figure;
imshow(I);
I=rgb2gray(I);
rot1=imrotate(I,33,'crop'); %旋转图像
bw=edge(rot1,'canny'); %使用边缘检测形成二值图像
[H,T,R]=hough(bw); %生成点的叠加矩阵和坐标T,R
figure;
imshow(H,[],'XData',T,'YData',R,'InitialMagnification','fit'); %显示统计点的图形
title('变换结果');
xlabel('\theta'),ylabel('\rho');
axis on,axis normal;hold on; %使坐标易于观察
p=houghpeaks(H,5,'threshold',ceil(0.3*max(H(:)))); %提取5个极值点,p中为极坐标的位置
x=T(p(:,2));y=R(p(:,1));
plot(x,y,'s','color','blue');
lines=houghlines(bw,T,R,p,'FillGap',5,'MinLength',7); %生成这五个点在图像中的直线矩阵
figure;
imshow(rot1);,hold on;
max_len=0;
for k=1:length(lines) %计算线的数量
xy=[lines(k).point1;lines(k).point2]; %
plot(xy(:,1),xy(:,2),'LineWidth',2,'Color','green'); %通过直线的起点和终点画出直线
plot(xy(1,1),xy(1,2),'x','LineWidth',2,'Color','red'); %标出起点和终点
len=norm(lines(k).point1-lines(k).point2);
if(len>max_len) %算出最大的直线
max_len=len;
xy_long=xy;
end
end
plot(xy_long(:,1),xy_long(:,2),'LineWidth',2,'Color','Cyan'); %标记出最大的直线

相关文章推荐
- Java中的菜单
- 读‘Web前端开发工程师编程能力飞升之路’感触
- Http的使用及XML和JSON数据解析
- MVC怎么在当前视图中,传递参数给到另外一个视图?
- 链接样式表和导入样式区别
- UML第七集
- 俄罗斯方块
- FancyBox效果(一)
- 毕向东udp学习笔记3多线程聊天
- NGUI研究院之UISprite和UITexture浅谈
- java中的垃圾收集与内存分配
- JAVA课程作业05
- 1.ActionBar
- 有没有可以达标的牛人
- 像原生C/C++,序列化Java对象
- How To: set udev rule for setting the disk permission on ASM disks when using multipath on Linux 6.x
- epoll代码示例
- HDU_4780_Candy Factory(最小费用流)
- Java GUI 相关知识
- php实战之使用递归读取商品无限分类