【D3.js数据可视化实战】--(2)本地时间轴
2015-10-21 20:18
926 查看
背景需求
绘制效果
实现思路
关键技术
完整代码
默认格式化:
本地格式化:
定义简体中文本地化
用本地时间格式化函数格式化数轴的刻度值
定义时间比例尺
指定轴的比例尺和格式化函数
绘制数轴
调整刻度样式
本例很简单,可以使用下面的代码测试效果,你学会了吗?
绘制效果
实现思路
关键技术
完整代码
背景需求
使用D3绘制图表一般都会绘制一个坐标轴,但是用D3画过图的同学都知道默认情况下绘制的坐标轴刻度是英文的。但是我们要的刻度是中文的。怎么办呢?且看本文讲解如何绘制本地时间轴。绘制效果
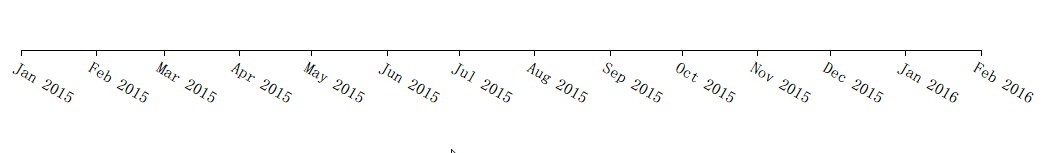
实现效果如何,先来一睹为快!默认格式化:
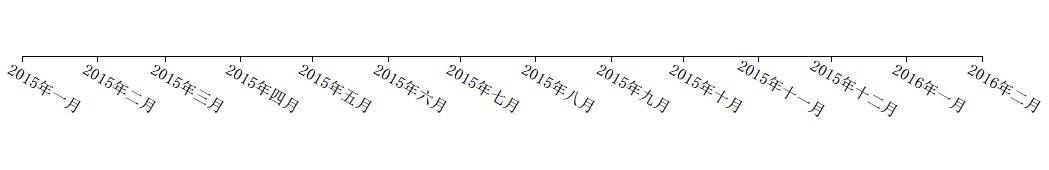
d3.time.format("%b %Y")本地格式化:
zh.timeFormat("%Y年%b")实现思路
思路很简单:定义简体中文本地化
用本地时间格式化函数格式化数轴的刻度值
关键技术
定义新的简体中文本地化//简体中文本地化
var zh = d3.locale({
decimal: ".",
thousands: ",",
grouping: [3],
currency: ["¥", ""],
dateTime: "%a %b %e %X %Y",
date: "%Y/%-m/%-d",
time: "%H:%M:%S",
periods: ["上午", "下午"],
days: ["星期日", "星期一", "星期二", "星期三", "星期四", "星期五", "星期六"],
shortDays: ["星期日", "星期一", "星期二", "星期三", "星期四", "星期五", "星期六"],
months: ["一月", "二月", "三月", "四月", "五月", "六月", "七月", "八月", "九月", "十月", "十一月", "十二月"],
shortMonths: ["一月", "二月", "三月", "四月", "五月", "六月", "七月", "八月", "九月", "十月", "十一月", "十二月"]
});定义时间比例尺
//时间比例尺 var timeScale = d3.time.scale() .domain([new Date(2015, 0, 1), new Date(2016, 1, 1)]) .range([0, width-40]);
指定轴的比例尺和格式化函数
//时间轴
var axis = d3.svg.axis()
.scale(timeScale)
.tickFormat(zh.timeFormat("%Y年%b"))//指定为本地格式化函数
.orient("bottom")绘制数轴
//添加时间轴
var svg = d3.select("body").append("svg")
.attr("width", width+200)
.attr("height", height)
.append("g")
.attr("class", "axis")
.attr("transform", "translate(" + 20 + "," + height/2 + ")")
.call(axis);调整刻度样式
//旋转文字
d3.selectAll('g.tick text').attr('transform','translate(30,20)rotate(30)')本例很简单,可以使用下面的代码测试效果,你学会了吗?
完整代码
<!DOCTYPE html>
<meta charset="utf-8">
<style>
body{
font-weight:bold;
}
.axis path, .axis line {
fill: none;
stroke: #000;
shape-rendering: crispEdges;
}
</style>
<body>
<script src="../../d3.js"></script>
<script>
//简体中文本地化
var zh = d3.locale({
decimal: ".",
thousands: ",",
grouping: [3],
currency: ["¥", ""],
dateTime: "%a %b %e %X %Y",
date: "%Y/%-m/%-d",
time: "%H:%M:%S",
periods: ["上午", "下午"],
days: ["星期日", "星期一", "星期二", "星期三", "星期四", "星期五", "星期六"],
shortDays: ["星期日", "星期一", "星期二", "星期三", "星期四", "星期五", "星期六"],
months: ["一月", "二月", "三月", "四月", "五月", "六月", "七月", "八月", "九月", "十月", "十一月", "十二月"],
shortMonths: ["一月", "二月", "三月", "四月", "五月", "六月", "七月", "八月", "九月", "十月", "十一月", "十二月"]
});
//svg宽,高
var width = 1000,height = 500;
//时间比例尺
var timeScale = d3.time.scale()
.domain([new Date(2015, 0, 1), new Date(2016, 1, 1)])
.range([0, width-40]);
//时间轴
var axis = d3.svg.axis()
.scale(timeScale)
.tickFormat(zh.timeFormat("%Y年%b"))
.orient("bottom")
//添加时间轴
var svg = d3.select("body").append("svg")
.attr("width", width+200)
.attr("height", height)
.append("g")
.attr("class", "axis")
.attr("transform", "translate(" + 20 + "," + height/2 + ")")
.call(axis);
//旋转文字
d3.selectAll('g.tick text').attr('transform','translate(30,20)rotate(30)')
</script>

相关文章推荐
- 学习prefuse
- JavaScript可视化图表库D3.js API中文参考
- D3.js中data(), enter() 和 exit()的问题详解
- ios、android 数据可视化图表赏析
- 奇虎360-数据可视化
- 软件即服务和云计算之间有什么区别
- (转)智能+可视化 看商业智能的发展方向
- 《Nevron NET Vision Enterprise 2007 v7.2.Q1》For VS2003 & For VS2005 FTP下载 技术共享
- 学习R网址
- 利用VTK对数据进行可视化的实例
- MATLAB-数据可视化笔记
- 计算机图形实现建模技术的3种方法
- 【斯坦福大学】计算机图形学实验室的概况
- D3 Zoom + Pan
- D3-SVG 画布完整的柱形图
- MATLAB与外部程序的数据交互三板斧
- 如何正确理解商业智能(BI)?--上
- d3.js学习笔记(一)
- d3.js学习笔记(二) 柱形图
- 推荐12款当前最流行的信息图表制作工具