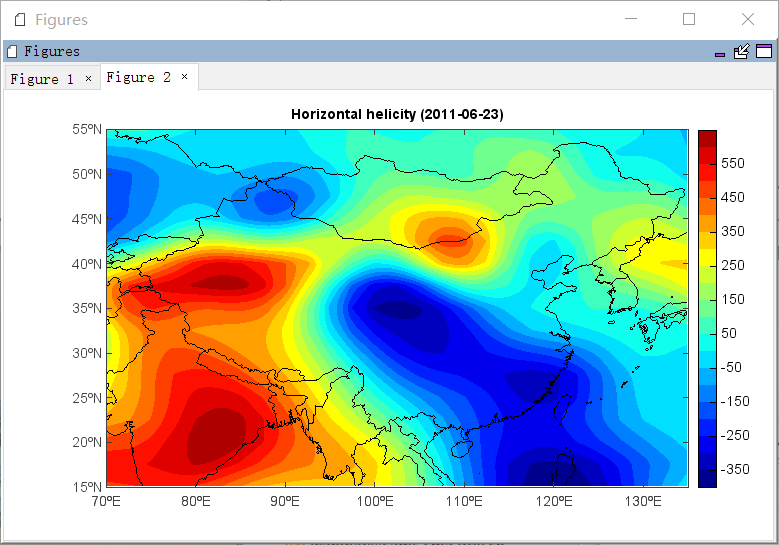
MeteoInfoLab脚本示例:计算水平螺旋度
2015-10-10 08:57
429 查看
尝试了用MeteoInfoLab编写计算水平螺旋度的脚本,结果未经验证。
脚本程序:
脚本程序:
print 'Open data files...'
f_uwnd = addfile('D:/Temp/nc/uwnd.2011.nc')
f_vwnd = addfile('D:/Temp/nc/vwnd.2011.nc')

print 'Calculate average wind field from 850 to 600 hpa...'
tidx = 173    # Jun 23, 2011
t = f_uwnd.gettime(tidx)
level = [850,600]    # 850 - 600 hPa
lat = [15,55]
lon = [70,135]
uvar = f_uwnd['uwnd']
vvar = f_vwnd['vwnd']
uwnd = uvar[tidx,level,lat,lon]
vwnd = vvar[tidx,level,lat,lon]
uc = uwnd.ave()
vc = vwnd.ave()
sp = magnitude(uwnd, vwnd)
speed = sp.ave()
#speed = magnitude(uc, vc)
direc = atan2(vc, uc)
cdirec = direc-40./180.*3.14159
if cdirec < -3.14159:
cdirec=cdirec+3.14159*2
cuc = speed*cos(cdirec)
cvc = speed*sin(cdirec)

print 'Calculate horizontal helicity...'
Hrs = 0.
zHrs = 0.
hh = 6
while hh <= 10:
zHrs = (uvar[tidx,hh+1,lat,lon]-cuc)*(vvar[tidx,hh,lat,lon]-cvc)- \
(uvar[tidx,hh,lat,lon]-cuc)*(vvar[tidx,hh+1,lat,lon]-cvc)
Hrs = Hrs+zHrs
hh += 1
Hrs = Hrs[::-1,:]

print 'Plot...'
axesm()
mlayer = shaperead('D:/Temp/map/country1.shp')
geoshow(mlayer, edgecolor='black')
layer = contourfm(Hrs, 20)
title('Horizontal helicity (' + t.strftime('%Y-%m-%d') + ')')
colorbar(layer)

相关文章推荐
- Transaction(事务)浅谈
- 关于math.round()
- 使用AFNetworking下载文件
- Linux共享内存,打印系统IPC信息
- JS数组定义
- 获取Spring管理的Bean方法
- 入库只能入库56张,就卡住了
- wex5是什么?号称可以跨平台开发的免费开源框架
- 基于粒子滤波的物体跟踪
- 21分钟 MySQL 入门教程
- iOS - UIButton(UIEdgeInsets)/设置button上的文字和图片 在定义位置
- Nhibernate
- NSData与NSMutableData
- MySQL核心基础(一)之数据库介绍
- [TwistedFate]bool类型,关系运算符,逻辑运算符,程序的三种结构,条件表达式,枚举类型,if,switch语句
- 今天要做的事
- Unknown tag (s:property).
- Java常用的一些多媒体文件基本操作方法简介
- AMP:Google 的新开源项目能让网页秒开
- Android listview与adapter用法