WPF 绘制图表
2015-09-19 13:13
369 查看
在工作中经常会遇到需要将一组数据绘制成曲线图的情况,最简单的方法是将数据导入Excel,然后使用绘图功能手动生成曲线图。但是如果基础数据频繁更改,则手动创建图形可能会变得枯燥乏味。本篇将利用DynamicDataDisplay
在WPF 中动态模拟CPU 使用率图表,实现动态生成曲线图。
新建项目将DynamicDataDisplay.dll 加载到References 中,打开MainWindow.xaml 添加命名空间xmlns:d3="http://research.microsoft.com/DynamicDataDisplay/1.0"。通过<d3:ChartPlotter> 创建一个图表框架,在其中添加两条整型坐标轴,X轴:<d3:HorizontalIntegerAxis>,Y轴:<d3:VerticalIntegerAxis>。<d3:Header>
用来设置图表名称,<d3:VerticalAxisTitle> 用来设置Y轴名称。

接下来工作需要通过C#每秒获取一次CPU使用率,并将这些数据生成坐标点(Point)绘制在图表中。 以下是MainWindow.xaml.cs 部分的代码内容。
通过ObservableDataSource<Point> 动态存储图表坐标点,PerformanceCounter 获取CPU使用率数值,DispatcherTimer 计时器在规定间隔进行取数操作,整型i 作为CPU使用率坐标点的X轴数值。
AnimatedPlot 事件用于构造坐标点,通过设置cpuPerformance 相关参数,并使用NextValue() 方法获取当前CPU使用率数据作为Y值,整型i 作为X值。将X、Y值构造为坐标点(Point),并通过异步方式存储在dataSource 中。
最后通过Window_Loaded 将事件加载到<Window> 中,AddLineGraph 方法将dataSource 中的坐标点绘制到图表中,曲线颜色定义为绿色,粗细设置为2,曲线名称为"Percentage"。设置计时器间隔为1秒,连续执行AnimatedPlot 事件实时绘制新坐标点。

鼠标右键可将图表拷贝到其他文档:
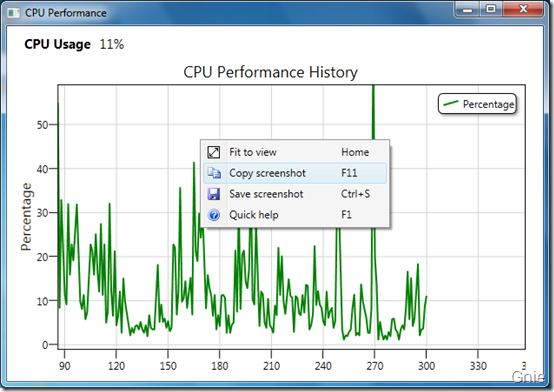
鼠标左键拖动图表浏览任意位置曲线数据,鼠标中键可以缩放显示曲线图。
WpfPerformance.zip
作者:李敬然(Gnie)
出处:{GnieTech} (http://www.cnblogs.com/gnielee/)
版权声明:本文的版权归作者与博客园共有。转载时须注明本文的详细链接,否则作者将保留追究其法律责任。
在WPF 中动态模拟CPU 使用率图表,实现动态生成曲线图。
新建项目将DynamicDataDisplay.dll 加载到References 中,打开MainWindow.xaml 添加命名空间xmlns:d3="http://research.microsoft.com/DynamicDataDisplay/1.0"。通过<d3:ChartPlotter> 创建一个图表框架,在其中添加两条整型坐标轴,X轴:<d3:HorizontalIntegerAxis>,Y轴:<d3:VerticalIntegerAxis>。<d3:Header>
用来设置图表名称,<d3:VerticalAxisTitle> 用来设置Y轴名称。
<Window x:Class="WpfPerformance.MainWindow"
xmlns="http://schemas.microsoft.com/winfx/2006/xaml/presentation"
xmlns:x="http://schemas.microsoft.com/winfx/2006/xaml"
xmlns:d3="http://research.microsoft.com/DynamicDataDisplay/1.0"
Title="CPU Performance" Loaded="Window_Loaded" Height="350" Width="525">
<Grid>
<Grid.RowDefinitions>
<RowDefinition Height="Auto"/>
<RowDefinition Height="*"/>
</Grid.RowDefinitions>
<StackPanel Orientation="Horizontal">
<TextBlock Text="CPU Usage" Margin="20,10,0,0"
FontSize="15" FontWeight="Bold"/>
<TextBlock x:Name="cpuUsageText" Margin="10,10,0,0"
FontSize="15"/>
</StackPanel>
<d3:ChartPlotter x:Name="plotter" Margin="10,10,20,10" Grid.Row="1">
<d3:ChartPlotter.VerticalAxis>
<d3:VerticalIntegerAxis />
</d3:ChartPlotter.VerticalAxis>

<d3:ChartPlotter.HorizontalAxis>
<d3:HorizontalIntegerAxis />
</d3:ChartPlotter.HorizontalAxis>

<d3:Header Content="CPU Performance History"/>
<d3:VerticalAxisTitle Content="Percentage"/>
</d3:ChartPlotter>
</Grid>
</Window>
接下来工作需要通过C#每秒获取一次CPU使用率,并将这些数据生成坐标点(Point)绘制在图表中。 以下是MainWindow.xaml.cs 部分的代码内容。
using System;
using System.Diagnostics;
using System.Windows;
using System.Windows.Media;
using System.Windows.Threading;
using Microsoft.Research.DynamicDataDisplay;
using Microsoft.Research.DynamicDataDisplay.DataSources;

namespace WpfPerformance
{
public partial class MainWindow : Window
{
private ObservableDataSource<Point> dataSource = new ObservableDataSource<Point>();
private PerformanceCounter cpuPerformance = new PerformanceCounter();
private DispatcherTimer timer = new DispatcherTimer();
private int i = 0;

public MainWindow()
{
InitializeComponent();
}

private void AnimatedPlot(object sender, EventArgs e)
{
cpuPerformance.CategoryName = "Processor";
cpuPerformance.CounterName = "% Processor Time";
cpuPerformance.InstanceName = "_Total";

double x = i;
double y = cpuPerformance.NextValue();

Point point = new Point(x, y);
dataSource.AppendAsync(base.Dispatcher, point);

cpuUsageText.Text = String.Format("{0:0}%", y);
i++;
}

private void Window_Loaded(object sender, RoutedEventArgs e)
{
plotter.AddLineGraph(dataSource, Colors.Green, 2, "Percentage");
timer.Interval = TimeSpan.FromSeconds(1);
timer.Tick += new EventHandler(AnimatedPlot);
timer.IsEnabled = true;
plotter.Viewport.FitToView();
}
}
}
通过ObservableDataSource<Point> 动态存储图表坐标点,PerformanceCounter 获取CPU使用率数值,DispatcherTimer 计时器在规定间隔进行取数操作,整型i 作为CPU使用率坐标点的X轴数值。
private ObservableDataSource<Point> dataSource = new ObservableDataSource<Point>();
private PerformanceCounter cpuPerformance = new PerformanceCounter();
private DispatcherTimer timer = new DispatcherTimer();
private int i = 0;
AnimatedPlot 事件用于构造坐标点,通过设置cpuPerformance 相关参数,并使用NextValue() 方法获取当前CPU使用率数据作为Y值,整型i 作为X值。将X、Y值构造为坐标点(Point),并通过异步方式存储在dataSource 中。
private void AnimatedPlot(object sender, EventArgs e)
{
cpuPerformance.CategoryName = "Processor";
cpuPerformance.CounterName = "% Processor Time";
cpuPerformance.InstanceName = "_Total";

double x = i;
double y = cpuPerformance.NextValue();

Point point = new Point(x, y);
dataSource.AppendAsync(base.Dispatcher, point);

cpuUsageText.Text = String.Format("{0:0}%", y);
i++;
}
最后通过Window_Loaded 将事件加载到<Window> 中,AddLineGraph 方法将dataSource 中的坐标点绘制到图表中,曲线颜色定义为绿色,粗细设置为2,曲线名称为"Percentage"。设置计时器间隔为1秒,连续执行AnimatedPlot 事件实时绘制新坐标点。
private void Window_Loaded(object sender, RoutedEventArgs e)
{
plotter.AddLineGraph(dataSource, Colors.Green, 2, "Percentage");
timer.Interval = TimeSpan.FromSeconds(1);
timer.Tick += new EventHandler(AnimatedPlot);
timer.IsEnabled = true;
plotter.Viewport.FitToView();
}
鼠标右键可将图表拷贝到其他文档:
动态演示
鼠标左键拖动图表浏览任意位置曲线数据,鼠标中键可以缩放显示曲线图。
源代码下载
WpfPerformance.zip作者:李敬然(Gnie)
出处:{GnieTech} (http://www.cnblogs.com/gnielee/)
版权声明:本文的版权归作者与博客园共有。转载时须注明本文的详细链接,否则作者将保留追究其法律责任。

相关文章推荐
- 如何成为一名专家级的开发人员
- WPF MVVM示例讲解
- PowerShell中调用WPF生成炫酷窗口实例
- C#中WPF使用多线程调用窗体组件的方法
- WPF实现渐变淡入淡出的登陆窗口效果
- .NET微信公众号开发之公众号消息处理
- WPF的数据绑定详细介绍
- WPF绑定实例详解
- 使用nodejs开发cli项目实例
- nodejs开发微博实例
- Egret引擎开发指南之创建项目
- Android开发自学笔记(二):工程文件剖析
- 关于WPF使用MultiConverter控制Button状态的详细介绍
- Web 开发常用工具 大家自己查找下载
- 三种Web开发主流技术的性价评价
- 在B/S开发中经常用到的JavaScript技术第1/3页
- 深入Android开发FAQ的详解
- Android生存指南之:开发中的注意事项
- asp.net 开发的一些常用技巧
- 如何搭建新的WPF项目框架