Test Design Techniques - STATE BASED TESTING
2015-08-19 16:12
417 查看
Test Design Techniques - STATE BASED TESTING
-Test note of “Essential Software Test Design”2015-08-19
Content:
13.1 The Model
13.1.1 The ATM Machine
13.2 Creating Base Test Cases
13.2.1 Ways of Covering the Graph
13.2.2 Coverage According to Chow
13.2.3 Creating Test Cases
13.2.4 Transition Pairs
13.2.4.1 Expanding the Table by one Column
13.2.4.2 Creating a Dual Graph
13.2.5 Transition Triples and More
A STATE GRAPH, or state transition testing, is a model-based technique for compiling test cases. It works with event-driven systems, often in real time, and is common in areas like digital technology and electronics in hardware.
13.1 The Model
top2 type:
Mealy Graphs, where the state is represented by nodes and the links between the nodes represent transitions.
Moore Graphs, where the events are represented by nodes.
Mealy Graphs are simpler to work with since they:
More closely resemble what happens on their actual implementation
Have fewer states, and since;
The states are stable
You can repeat events more easily without the graph becoming more complex
We call the states nodes, and call connections between the nodes links.
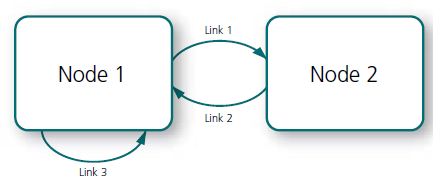
Figure 13.1: State Graphs consist of nodes and links. An arc is also called a transition. Links which start and end at the same node denote that an event does not lead to a transition, but it still undergoes some form of process.
Steps compile a graph:
Compile the different states an object can find itself in
Compile the transitions between the different states
Identify the events which cause a transition to occur
Define what happens during each transition
13.1.1 The ATM Machine
1. The different states are as follows:a) Standby – nobody has inserted a card into the machine yet
b) Card inserted, request for PIN
c) PIN accepted – waiting for transaction
2. Draw arrows for the transitions according to the function descriptions
3. Events causing transition are:
a) Insert card
b) Enter correct PIN
c) Enter incorrect PIN
d) Enter correct transaction
e) Enter incorrect transaction
f) Choose to abort
4. What is carried out during transition is:
a) Request new PIN
b) Request new card
c) Request transaction
d) Eject money, card and receipt (execute transaction)
You have now created the picture below and the difficult work is complete.
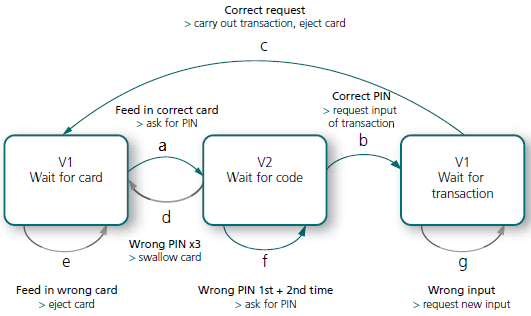
Figure 13.2: Very simple state graph for an ATM. In reality, there are more states and events that are interesting to test and should be present in a complete graph.
13.2 Creating Base Test Cases
top13.2.1 Ways of Covering the Graph
There are a number of variants of how to fill in the graph you have drawn up, besides the one described above. Some of them are:Typical routes. The most credible combinations
The travelling salesman’s route. All different states in one test case.
The Chinese Postman’s route. All transitions in the same test case, if there is that possibility.
Risk-based. Routes where you think that a particular combination of transitions can cause problems.
All routes a certain length. From shortest to longest until you have covered all combinations. This is suited to automation, since it repeats many combinations and takes a long time to carry out.
All ways of leaving a state. For example, via a menu, function key, hot key, button and so on.
All events which should not produce a transition. Verifies the system’s robustness.
13.2.2 Coverage According to Chow
One method is to cover, firstly, all transitions, then all transitions pairs, triples etc. This was originally presented by Chow.When you generate the test cases, there are different levels in the degree of coverage. Covering every individual transition is often called Chow’s 0-switch coverage. This can be visualized in a simple table.
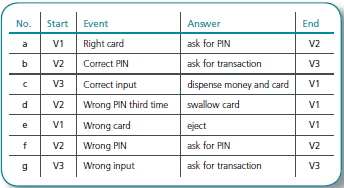
Figure 13.3: Table of the different transitions in the state graph for the ATM. The simplest form of test coverage is to test all the rows in the table.
13.2.3 Creating Test Cases
The next step is to generate the test cases and, in parallel with this, mark off the transitions you are covering.Test Case 1 (transitions b, c, e, f and g are covered)
Insert card (V1)
Enter wrong code (V2)
Enter correct code (V2)
Enter transaction (V3)
Take card and money (V1)
Test Case 2 (transition a is covered)
Insert wrong card (V1)
Take ejected card (V2)
Test Case 3 (transition d is covered)
Insert card (V1)
Enter wrong code (V2)
Enter wrong code (V2)
Enter wrong code (V2)
Card is swallowed and you are back at the starting point (V1)
13.2.4 Transition Pairs
In order to achieve better coverage, you can use what we call transition pairs, involving two transitions in a row. The idea is that the result of an event in the system depends on what has happened in the preceding event. Sometimes, you will see the term 1-switch coverage.13.2.4.1 Expanding the Table by one Column
There are two different ways of solving this, the first being to start with the first table and adding one additional column.
Analysis of our ATM produces the following 16 links:
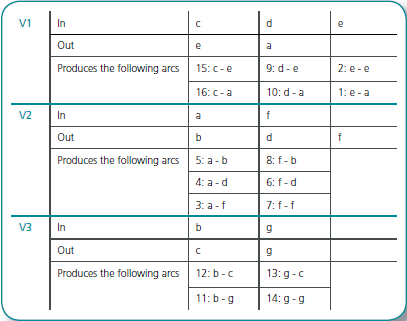
Figure 13.5: Table showing development of transition pairs for the state graph ATM. We obtain all pairs by combining all routes into a node with all routes out of it. Even self-transactions, where we stay on the same node after transition, are counted.
The consolidated table is below, but columns showing event/answer have been taken out in order to simplify the table
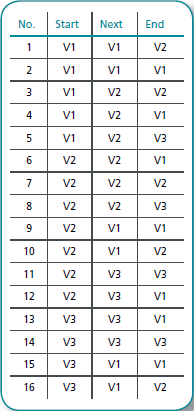
Figure 13.6: Consolidated table of transition pairs for ATM state graph. A more accurate form of coverage is to test all combinations of two transitions. Obviously, this requires more test cases.
13.2.4.2 Creating a Dual Graph
You can also generate a dual graph, where the transitions represented earlier by links are substituted by nodes: in other words, a Moore graph. This way of testing all paired transitions is called the de Bruijn algorithm. To generate a dual graph, you do the following:
Generate a graph where the links in the original have been changed to nodes.
Everywhere in the original graph where arc 1 comes into a node, and arc 2 goes out of it, draw an arc between node 1 and node 2. Every arc will now represent a transition pair.
Cover all links now with test cases.

Figure 13.7: Original and dual graph for the ATM. An alternative to developing the table of transition pairs is to create a Moore graph, where each transition represents a transition pair in the Mealy graph.
13.2.5 Transition Triples and More
You can proceed to more stringent requirements by setting up transition triples and quadruples, by adding another column in the table of transition pairs. The problem is that the number of test cases grows very quickly, so it is often difficult to test all of the pairs without automating the tests. It is common to use at least transition pairs and, if you find many defects, to press on, with more advanced tests in certain areas.
相关文章推荐
- 安卓UI布局常见警告
- UUID的组成
- iOS开发学习之UIWindow
- UE4 Performance Guidelines for Mobile Devices
- java并发容器(Map、List、BlockingQueue)详解
- poj 1986——Distance Queries
- Web交互设计优化的简易check list
- IOS第11天(2:UIPickerView自定义国旗选择)
- 关于Bean的知识private static final long serialVersionUID = 1L
- hdu 3717 Rescue 二分加队列优化(技巧)
- Android UI学习 - 对话框
- IOS第11天(1:UIPickerView点餐)
- 2015 Multi-University Training Contest 6 hdu 5357 Easy Sequence
- 【POJ 1019】 Number Sequence
- Call requires API level 3 (current min is 1)问题解决
- HDU 5400 Arithmetic Sequence
- iOS 在UILabel显示不同的字体和颜色
- UITextField UITextView隐藏键盘的方法
- iOS 在UILabel显示不同的字体和颜色
- EasyUI combobox--给combobox绑定值