android profile memory usage
2015-08-15 11:55
429 查看
Diagnosing memory usage in a Xamarin.Android application developed with Visual Studio
I recently had cause to diagnose the memory usage of an Android application developed with
Studio. The application was throwing "Out of memory" exceptions. There didn't appear to be a pattern as to how these were being created by the application, and there were several steps involved to recreate them, so making the job of isolating the cause of
the error very difficult.
In order to get a better understanding on what was going on, I used the Android Debug Monitor tool. This is a tool that is installed as part of the Android
SDK. You will find it installed in the following folder (depending on your version of Windows).
This article will describe how you can use this tool to diagnose memory usage in your
Although the article was written with Visual Studio and C# in mind, it also lends itself to Eclipse and Java.
Android applications by their very nature are intended to run on low powered, low memory devices including smart phones and tablets. For this reason, memory is a valuable resource due to its relative scarcity (when compared to a higher spec desktop PC or
laptop).
A detailed description of how memory is managed by Android (or more specifically Android's Dalvik virtual machine) is beyond the scope of this article. Suffice to say that memory is managed in such
a way as to make it highly efficient given that it is relatively more scarce when compared to higher spec desktop PCs and laptops.
In common with the Microsoft.NET Framework, Android has an integrated garbage collector that works broadly in a very similar way, i.e., it will release memory when it is no longer required. For example,
when your application is closed, it is pushed onto the application stack (a list of currently running applications whereby one will be in the foreground and all the others are in the background). When this happens, Android deems the resources currently assigned
to your application to be available for use by the foreground application. So any memory that is used by your application will be re-assigned to the foreground application. There may be exceptions to this (for example, if your application is currently processing
a background service), but broadly speaking, background applications will release their resources to the foreground application.
For the purposes of this article, it is assumed that you have installed the
Debug Monitor used in this article was 22.3.0.
Navigate to your Android SDK folder (its location is described above) and double click on the monitor.bat file.
To make things easier, you could add the Android Debug Monitor tool to your Visual Studio IDE. If you haven't done this before, navigate to your Tools menu
and click on the External Tools... menu option.
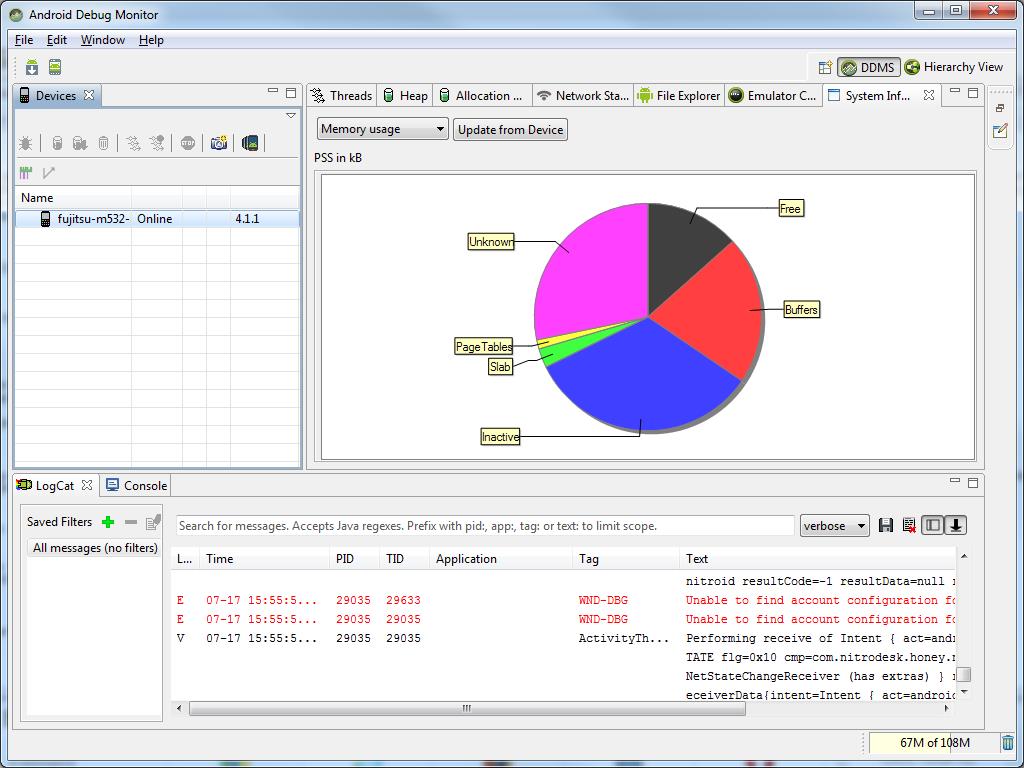
Assuming your device is correctly configured with Visual Studio, then you should be presented with the Android Debug Monitor tool as above.
As you can see from the screen shot above, on the left is a list of the attached device(s) that you may wish to monitor for memory usage. To the right are a series of tabs, each one displaying a different view of your application's resources such as memory
and threads.
Along the top right of the screen, you will see two buttons for viewing system resources. DDMS (Dalvik Debug Monitor Server) and Hierarchy View.
For the purposes of this article, I will focus on the DDMS view .
the DDMS as an integrated component of the Android Debug Monitor.
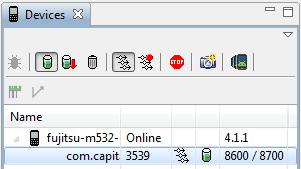
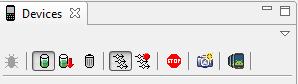
Start by selecting the device you wish to monitor from the left hand pane on the Devices tab.
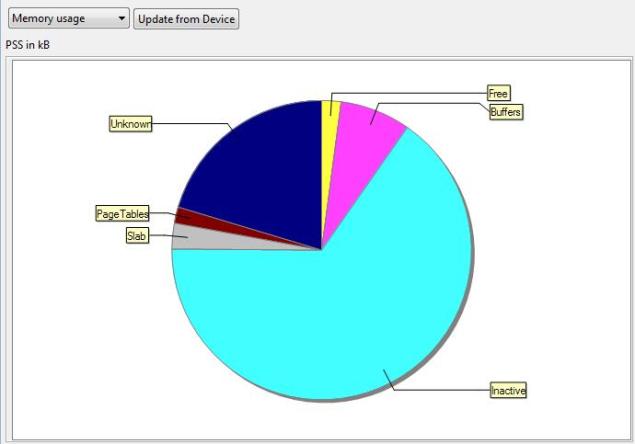
Click on the System Information tab from the right hand side pane. You will see a dropdown displayed on this pane.
Memory usage - gives you a view of what processes are consuming the memory on your Android device
CPU load - gives you a view of how those processes are consuming the CPU on your Android device
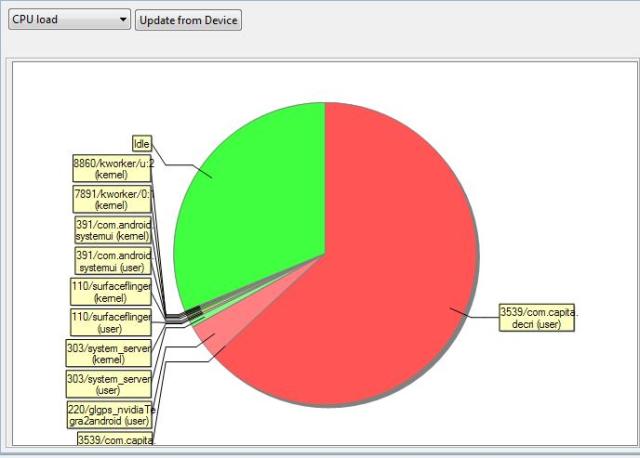
To update the information that is displayed on the Memory usage and CPU load panes, you will need to click on the Update
from Device button.
To the left of the device you want to monitor an arrow. You may need to click on the device name in the list first. Click on the arrow and this will give you a list of the currently running applications on the device. Select the application you want to monitor.
When you select an application, the icons above this become enabled.
Click on the Update Heap icon to view the heap information. This is the icon that resembles a green barrel. Doing so populates the Heap tab
with heap data as in the following screen shot.
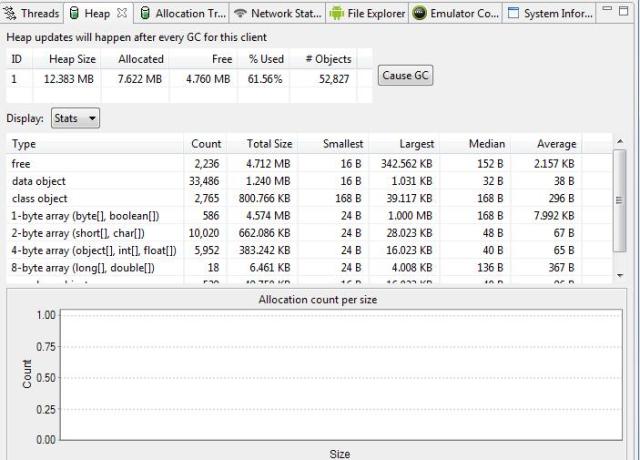
The information displayed on this tab is updated after every GC (garbage collection) operation performed by your Android device and so is updated in real-time.
The Heap pane displays summary information at the top with more detailed information at the bottom.
For my own debugging purposes, I found the summary information at the top to be more than adequate. This shows the following useful information.
Heap size in MB
Allocated heap size in MB
Free heap size in MB
% Used
# Objects
As I tested my application and monitored these heap values, I was able to identify the areas of the application that required investigation. As stated already, these values are updated in real-time after each garbage collection.
Clicking on a heap type from the list displays a detailed graph of the associated allocation count per size.
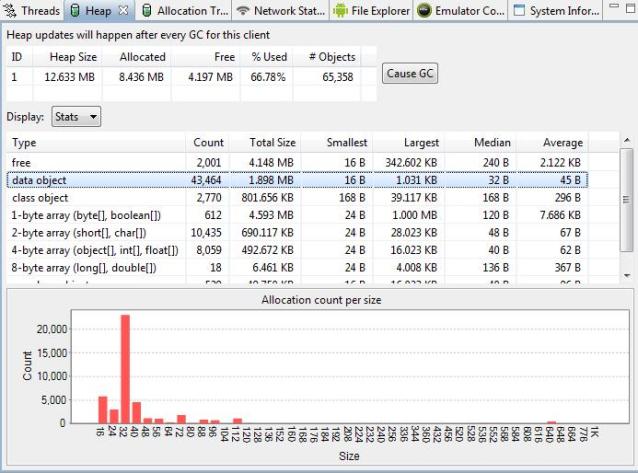
This information can be useful to help narrow down memory issues by allowing you see where your application is allocating its memory.
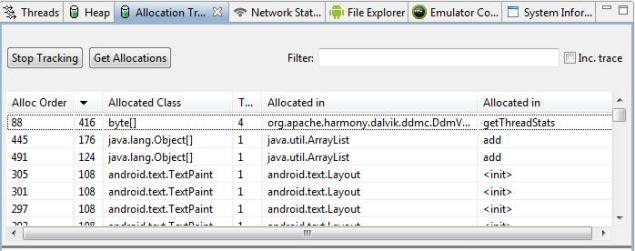
Click on an allocation to see the stack trace that led to the allocation. This gives detailed information about the type of object that was allocated, the thread, class and in which file.
Click on the Start Tracking button followed by Get Allocations button to monitor memory allocations.
To enable thread information to be displayed, click on the application you wish to monitor as we did previously. Then click on the Update Thread icon.
Clicking on an individual thread gives you the stack trace that spawned the thread.
just such a function. In the screen shot below, it is the icon to the far right.
Clicking on this icon creates a screen capture. This can be useful for application documentation or if your testers need a way to document the steps they have taken in creating a defect.
These screen capture images are saved to your profile's temp folder. Hovering your mouse over the name in the tab gives you the full path and filename.
This useful little tool can give you a lot of information about your Android application's system resources. It is well worth spending the time to explore this tool further to see what other functionality it has to offer. Hopefully, this article has given
you a start. Feel free to leave a comment if you would like me to further elaborate on anything within this article.
This article, along with any associated source code and files, is licensed under The
Code Project Open License
Introduction
I recently had cause to diagnose the memory usage of an Android application developed with Xamarin.Androidand Visual
Studio. The application was throwing "Out of memory" exceptions. There didn't appear to be a pattern as to how these were being created by the application, and there were several steps involved to recreate them, so making the job of isolating the cause of
the error very difficult.
In order to get a better understanding on what was going on, I used the Android Debug Monitor tool. This is a tool that is installed as part of the Android
SDK. You will find it installed in the following folder (depending on your version of Windows).
C:\Users\<username>\AppData\Local\Android\android-sdk\tools\monitor.bat
This article will describe how you can use this tool to diagnose memory usage in your
Xamarin.Androidapplications.
Although the article was written with Visual Studio and C# in mind, it also lends itself to Eclipse and Java.
Background
Android applications by their very nature are intended to run on low powered, low memory devices including smart phones and tablets. For this reason, memory is a valuable resource due to its relative scarcity (when compared to a higher spec desktop PC orlaptop).
A detailed description of how memory is managed by Android (or more specifically Android's Dalvik virtual machine) is beyond the scope of this article. Suffice to say that memory is managed in such
a way as to make it highly efficient given that it is relatively more scarce when compared to higher spec desktop PCs and laptops.
In common with the Microsoft.NET Framework, Android has an integrated garbage collector that works broadly in a very similar way, i.e., it will release memory when it is no longer required. For example,
when your application is closed, it is pushed onto the application stack (a list of currently running applications whereby one will be in the foreground and all the others are in the background). When this happens, Android deems the resources currently assigned
to your application to be available for use by the foreground application. So any memory that is used by your application will be re-assigned to the foreground application. There may be exceptions to this (for example, if your application is currently processing
a background service), but broadly speaking, background applications will release their resources to the foreground application.
For the purposes of this article, it is assumed that you have installed the
Android SDK. The version of Android
Debug Monitor used in this article was 22.3.0.
Launching the Android Debug Monitor tool
Navigate to your Android SDK folder (its location is described above) and double click on the monitor.bat file.To make things easier, you could add the Android Debug Monitor tool to your Visual Studio IDE. If you haven't done this before, navigate to your Tools menu
and click on the External Tools... menu option.
Assuming your device is correctly configured with Visual Studio, then you should be presented with the Android Debug Monitor tool as above.
The Android Debug Monitor Tool
As you can see from the screen shot above, on the left is a list of the attached device(s) that you may wish to monitor for memory usage. To the right are a series of tabs, each one displaying a different view of your application's resources such as memoryand threads.
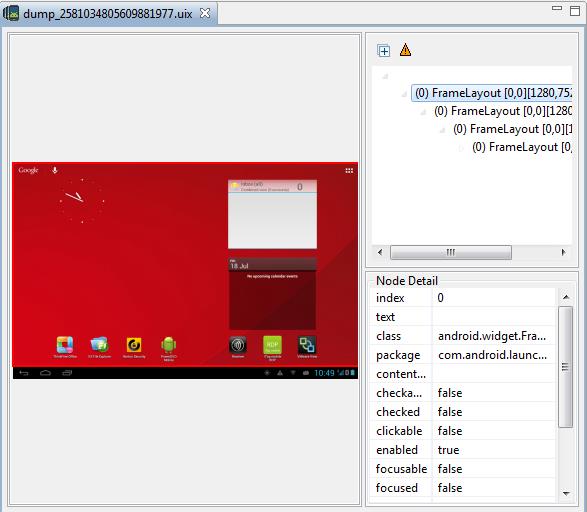
Along the top right of the screen, you will see two buttons for viewing system resources. DDMS (Dalvik Debug Monitor Server) and Hierarchy View.
For the purposes of this article, I will focus on the DDMS view .
DDMS
Android ships with a debugging tool called DDMS. This provides information relating to memory, heaps, threads, processes and more. It can also provide screen capturing and logging services. Think ofthe DDMS as an integrated component of the Android Debug Monitor.
Exploring Android Debug Monitor
Start by selecting the device you wish to monitor from the left hand pane on the Devices tab.System Information
This tab gives you an overview of how the device's system resources are being used, i.e., memory and CPU. It displays this information in a simple pie-chart.Click on the System Information tab from the right hand side pane. You will see a dropdown displayed on this pane.
Memory usage - gives you a view of what processes are consuming the memory on your Android device
CPU load - gives you a view of how those processes are consuming the CPU on your Android device
Memory Usage
CPU Load
To update the information that is displayed on the Memory usage and CPU load panes, you will need to click on the Update
from Device button.
Heap
This tab gives you an overview of how the device's heap memory is being used, i.e., the memory assigned for running applications.To the left of the device you want to monitor an arrow. You may need to click on the device name in the list first. Click on the arrow and this will give you a list of the currently running applications on the device. Select the application you want to monitor.
When you select an application, the icons above this become enabled.
Click on the Update Heap icon to view the heap information. This is the icon that resembles a green barrel. Doing so populates the Heap tab
with heap data as in the following screen shot.
The information displayed on this tab is updated after every GC (garbage collection) operation performed by your Android device and so is updated in real-time.
The Heap pane displays summary information at the top with more detailed information at the bottom.
For my own debugging purposes, I found the summary information at the top to be more than adequate. This shows the following useful information.
Heap size in MB
Allocated heap size in MB
Free heap size in MB
% Used
# Objects
As I tested my application and monitored these heap values, I was able to identify the areas of the application that required investigation. As stated already, these values are updated in real-time after each garbage collection.
Clicking on a heap type from the list displays a detailed graph of the associated allocation count per size.
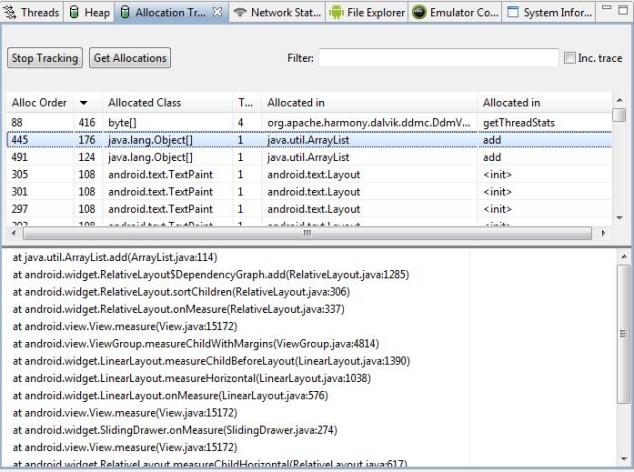
Allocation Tracking
This tab gives you more detailed memory information to allow you to analyse (track) where memory is being allocated and what is it being allocated to.This information can be useful to help narrow down memory issues by allowing you see where your application is allocating its memory.
Click on an allocation to see the stack trace that led to the allocation. This gives detailed information about the type of object that was allocated, the thread, class and in which file.
Click on the Start Tracking button followed by Get Allocations button to monitor memory allocations.
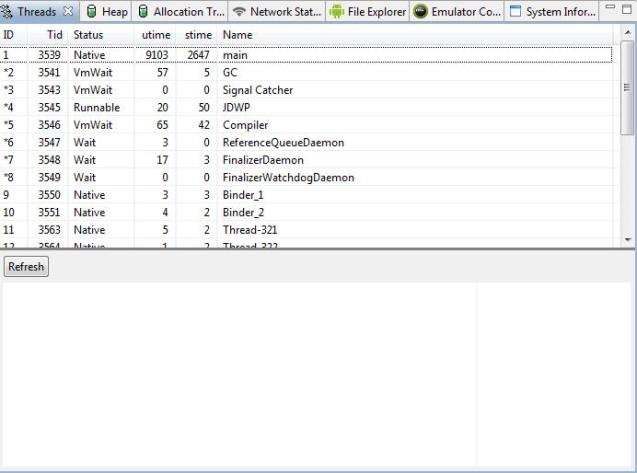
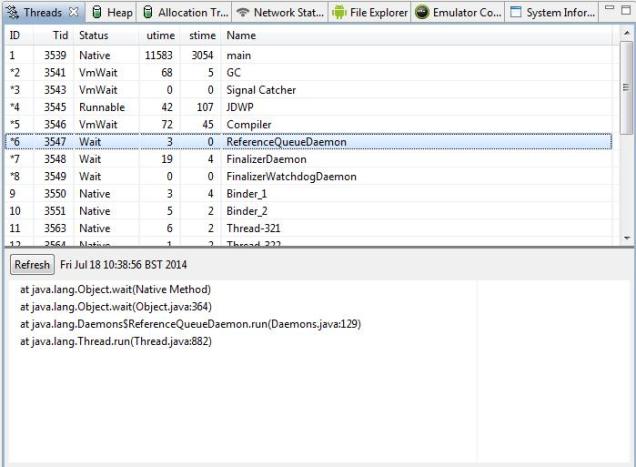
Threads
This tab displays information about your application's threads.To enable thread information to be displayed, click on the application you wish to monitor as we did previously. Then click on the Update Thread icon.
Clicking on an individual thread gives you the stack trace that spawned the thread.
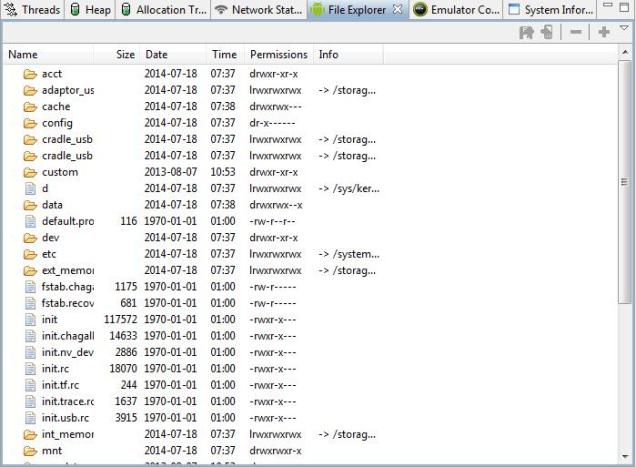
File Explorer
This tab shows you the file / directory structure of your device similar to Windows Explorer.Screen Capture
If for any reason you require a screen capture from one of your application's screens, thenAndroid Debug Monitorcontains
just such a function. In the screen shot below, it is the icon to the far right.
Clicking on this icon creates a screen capture. This can be useful for application documentation or if your testers need a way to document the steps they have taken in creating a defect.
These screen capture images are saved to your profile's temp folder. Hovering your mouse over the name in the tab gives you the full path and filename.
Summary
This useful little tool can give you a lot of information about your Android application's system resources. It is well worth spending the time to explore this tool further to see what other functionality it has to offer. Hopefully, this article has givenyou a start. Feel free to leave a comment if you would like me to further elaborate on anything within this article.
License
This article, along with any associated source code and files, is licensed under TheCode Project Open License

相关文章推荐
- android string.xml中显示特殊字符
- android-----上传文件到服务器
- Android 开发中 如何将xml文件封装成对象,存放到数组中?
- 提高Android开发效率——快捷键使用
- 改变Android Studio中AVD的创建路径
- Android进程的生命周期及其进程等级分析
- 【Android】 -- 使用UncaughtExceptionHandler捕捉全局异常
- 安卓开发之简单的短信操作模块
- android开发之bitmap使用
- android开发之bitmap使用
- android开发之bitmap使用
- android开发之bitmap使用
- android中设置控件背景的3种方式
- inflate与setcontentview及findviewbyid(二)
- Android跨进程访问(AIDL服务)
- Android中的文字识别(论文精简版)
- android中src和background区别
- Android(java)学习笔记160:Framework运行环境之 Android进程产生过程
- Android—Android中监听EditText文本输入,实现修改用户名,清除密码
- Android POST和GET传输的区别